A powerful data workspace with a built-in AI analyst.
Briefer helps anyone on your team turn data into insights through SQL, Python, and point-and-click visualizations.
Used by thousands of engineers and data scientists, including teams at
How it works
A place for humans and AI to generate insights
Connect your data sources, run SQL queries, create visualizations, execute Python code, and share notebooks and dashboards. Our AI analyst is here to help.
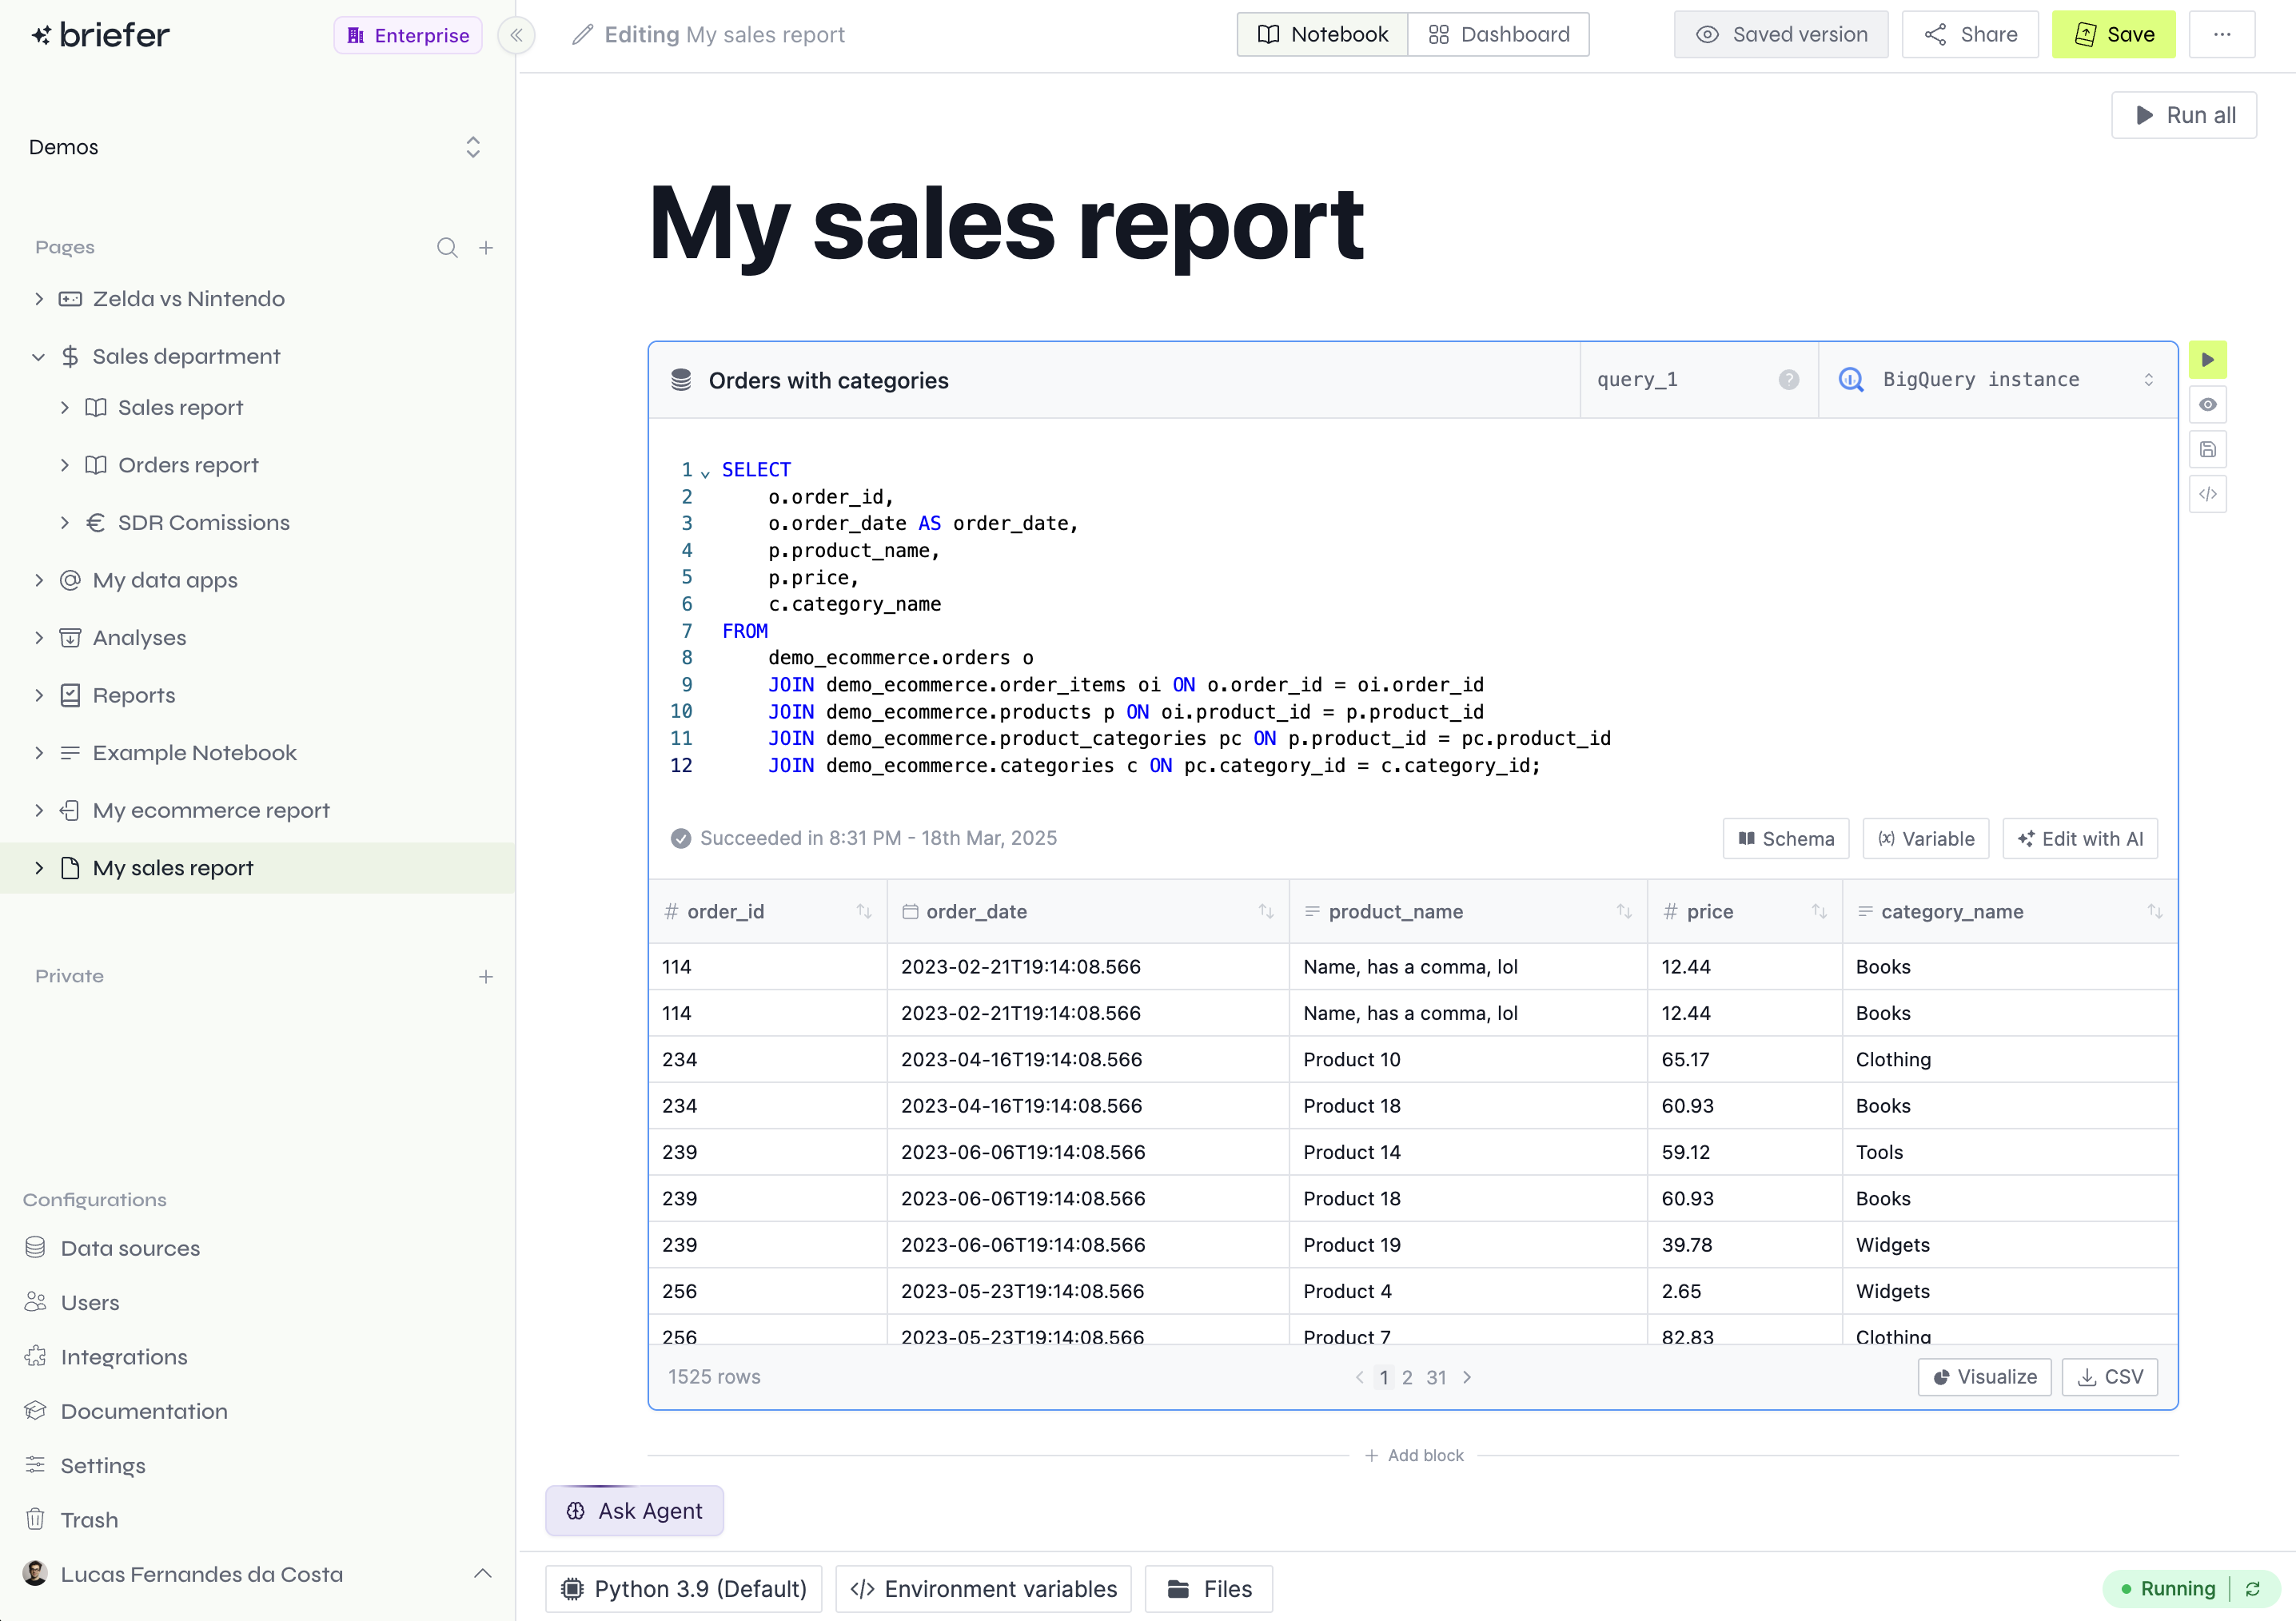
SQL support
Query any database, seamlessly plot or transition into Python
Write SQL with AI assistance or upload context for smarter queries. Every result automatically becomes a Python dataframe, ready for analysis, visualization, or further processing in code blocks.


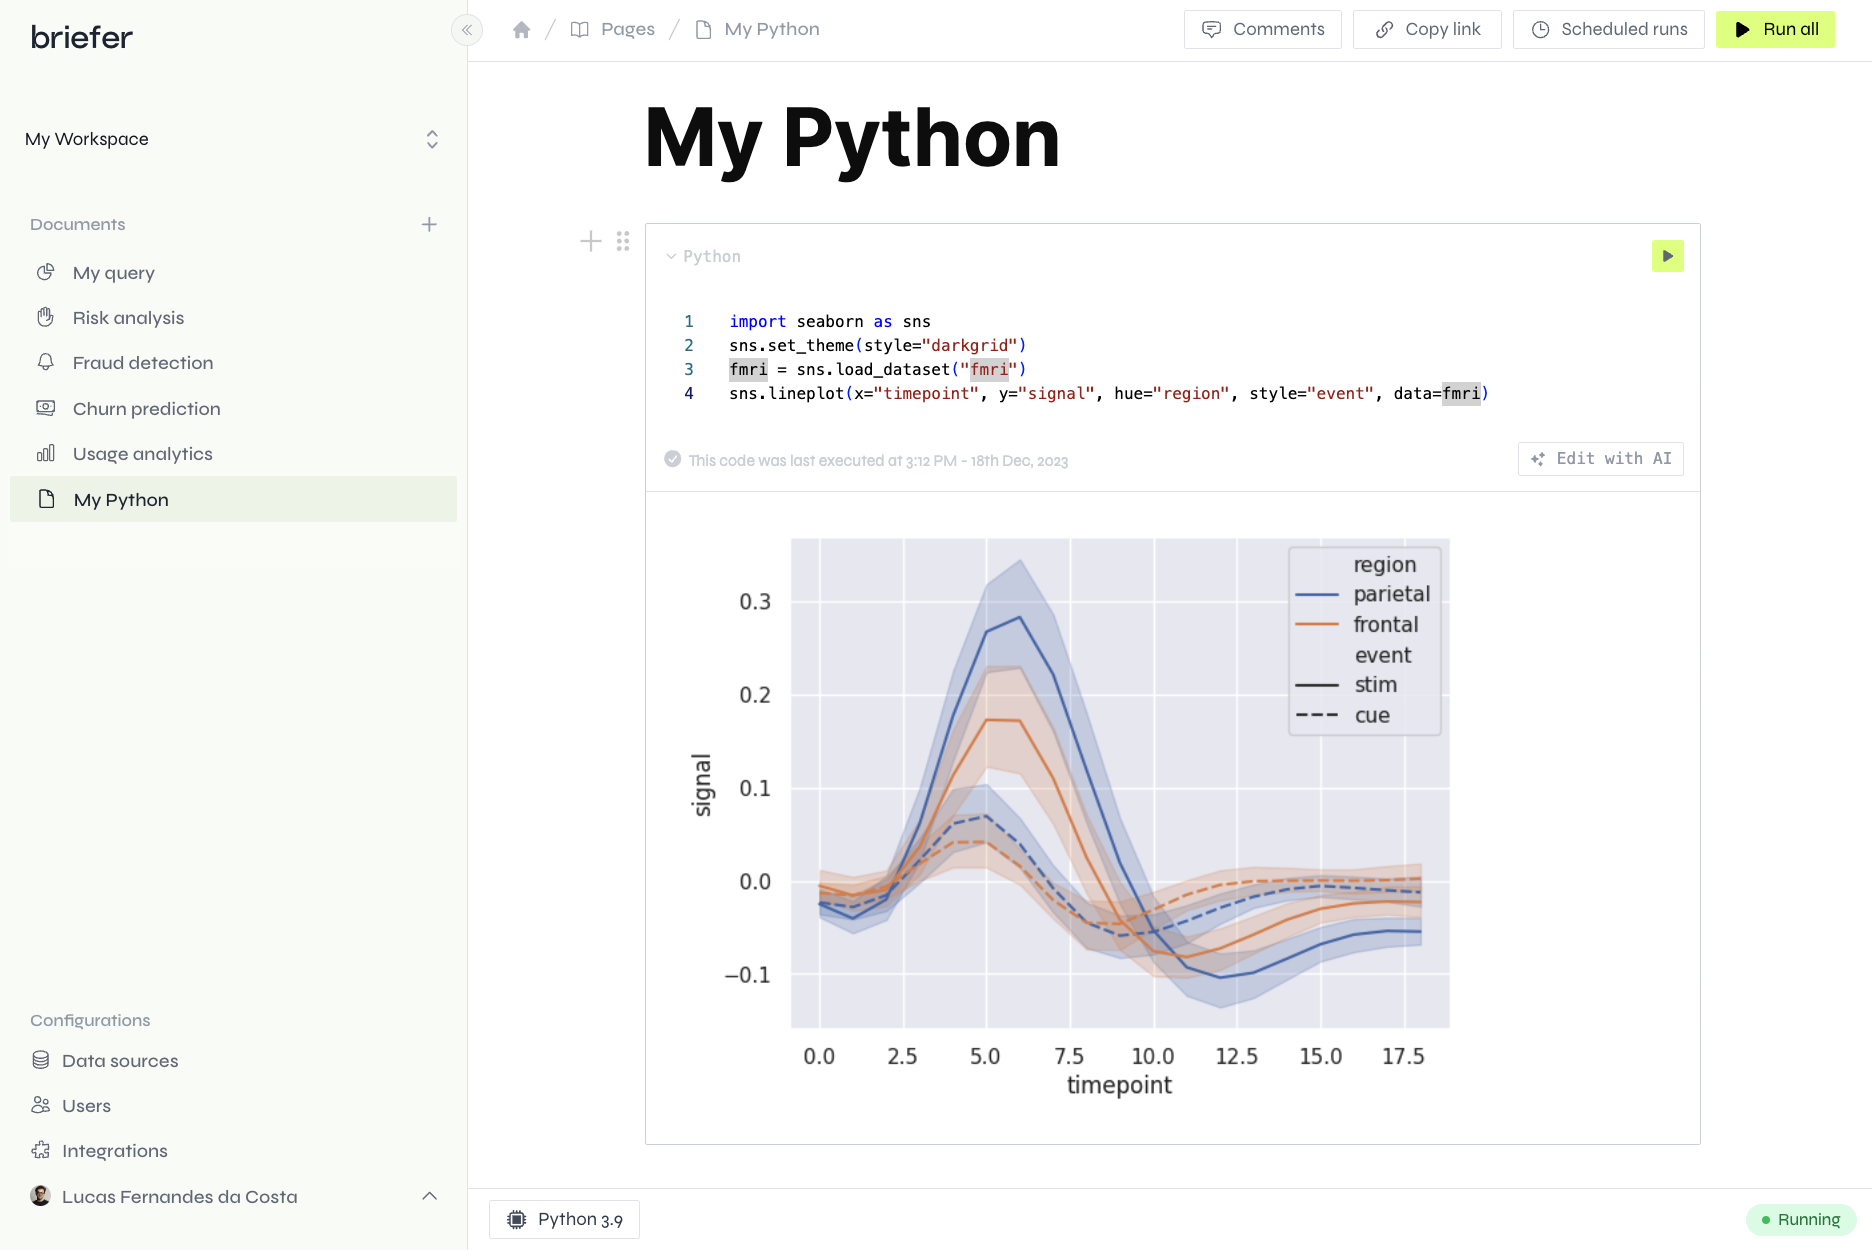
Python
Analyze, manipulate, or plot data with Python
Perfect for exploratory analyses, creating advanced visualizations, or building predictive models - all with AI-assisted coding so you can focus on insights, not syntax.
- Use AI to write code and fix errors.
- Instead of writing code, just describe what you want to do. If you make a mistake, the AI will fix it for you.
- Use query results as dataframes.
- Briefer automatically converts query results into dataframes that you can use in Python blocks.
- Schedule executions.
- Schedule your Python blocks to run on a recurring schedule. Ideal for writebacks or training and monitoring ML models.
- Show what matters.
- Hide all the data wrangling and show only the results that matter.
Turn notebooks into Python-powered dashboards
Present insights as notebooks or dashboards
In Briefer, every page can be published as a notebook or dashboard. You decide what to show and what to hide.
- Dashboard-mode or report-mode.
- Choose between publishing your notebook as a dashboard or a traditional report.
- Hide irrelevant code.
- Add multiple blocks to fetch, transform, and plot data. Then, choose which blocks to publish and which to hide.
- Add filters and inputs.
- Use dropdowns, text fields, and date inputs to create interactive dashboards and apps.
- Email and slack notifications.
- Schedule your notebooks to run and send a PDF report to your email or Slack.
- Generate snapshots.
- We'll take a snapshot of your notebook every time it runs. That way, you can see how your data evolved over time.
- Create public links.
- Create a public link to share your reports and dashboards with anyone, like a client or a colleague.
Build data apps
Use inputs, dropdowns, sliders, and date selectors to create interactive pages that your team can use to explore data and make decisions.
- Model prototyping
- Customer segmentation
- Churn prediction
- Demand forecasting
- Retention analysis
- Revenue attribution
Collaborate with your team in real-time
Briefer gets your team on the same page (literally).
- Multiplayer editing
- See who's editing which part of the document and collaborate in real time.
- Comments
- Add comments, raise issues, and tag your teammates in any part of the document.
- Presentation mode
- Hide code from non-technical stakeholders and present your findings in a clean, easy-to-read format.
- Granular permissions
- Control who can view or edit which workspace, and the data sources in each.