
This guide will walk you through a real-world example of how you can use AI to find insights in a dataset. Specifically using Brifer, a platform that makes working with data feel natural.
Why Consider Using AI for Data Analysis (LLMs and Agents)
AI-powered tools, especially those leveraging large language models (LLMs) and autonomous agents, are transforming data analysis. They reduce the friction of traditional workflows, enabling analysts and product teams to:
- Ask questions in natural language instead of SQL or Python.
- Automate exploratory data analysis (EDA).
- Suggest transformations, fill missing values, or detect anomalies.
- Generate code and visualization specs.
- Deliver insights faster with fewer iterations.
These systems are not just assistants. When configured properly with access to databases, documentation, and metrics catalogs, they become proactive data collaborators.
The Critical Decision: build an in-house text-to-sql bot VS. use a ready-made tool (Briefer)
Here’s a clear decision framework for choosing between building your own solution and using a robust tool like Briefer.
A big promise of AI for data analysis is making data accessible to non-technical people. Being able to ask questions in natural language is a big part of that. Someone on the business team can come up to a dataset and ask a question like "How many users churned last month?" and get an answer; without needing to write SQL or wait on a data analyst.
One way to build that is with text-to-SQL bots. They convert plain English into SQL so the database can be queried directly. This sounds great in theory. And at first glance, building a simple version looks easy. You can connect a large language model, give it access to your database schema, write a prompt, and maybe even get a few working queries.
But getting something useful, let alone reliable, is much harder. Queries break the moment your schema changes. The bot chokes on vague or complex questions. Debugging is tedious. Every improvement requires prompt surgery and re-testing. And once users start relying on it, you're stuck maintaining a fragile system.
So before jumping in, ask yourself: should you really build this yourself or just use a tool like Briefer that already handles all the hard parts? In resume:
You should build a text-to-sql bot when:
-
You have very few tables with unambiguous semantics: Think 5-10 cleanly named, well-related tables. This is rare. Most products are more complex.
-
You have spare engineering capacity to maintain an extra tool: Schema syncing, API version upgrades, consistency across environments, and graph rendering are all challenges. Unless you have a tooling team, it’s a poor investment.
-
You don’t need rigorous data access controls: If security isn’t a concern, this might be fine. But the moment you need any kind of access control, you’re in trouble. Building that yourself takes forever. Briefer already has these controls built in, so you don’t have to think about it.
You should use a pre-built tool (like Briefer) when:
-
You have many tables and complex schemas: Briefer can understand joins and metadata faster than a custom agent.
-
You want your engineers focused on product, not infrastructure: No need to reinvent the wheel when secure, scalable solutions already exist.
-
You need row-level access controls and security: Briefer and similar platforms offer built-in permission layers and access auditing.
-
You want to iterate fast with no infra maintenance: Use APIs, plug into Slack, and deliver insights immediately. Briefer's AI agent is built for getting insights faster and easier: it interprets your question, understands your schema and metrics logic, generates the query, checks for permissions, and returns the result; all in seconds.
The goal and the dataset
Let's walk though how we'd use AI to help solve a real business problem: Predicting customer churn, which is the phenomenon of customers stopping or canceling their use of a product or service.
The goal is to explore a sample dataset from a platform and identify what factors are most correlated with churn. We'll rely on Briefer to help us clean, prep, and make sense of the data.
Step 1: Environment Setup and Data Loading
Before we can ask questions, we need to connect to the data. Fortunately, Briefer makes this part seamless.
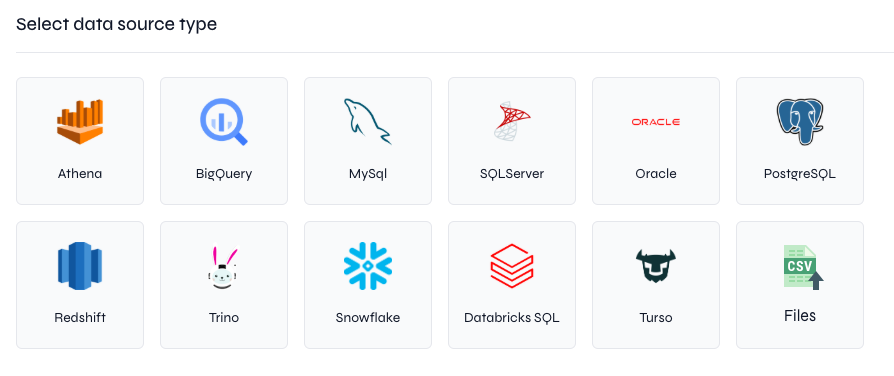
It supports direct connections to all the major databases data teams use like PostgreSQL, BigQuery, Redshift, MySQL, SQL Server and Snowflake. No need for scripting, drivers, or special configurations. Just go to the Data Sources page and connect:
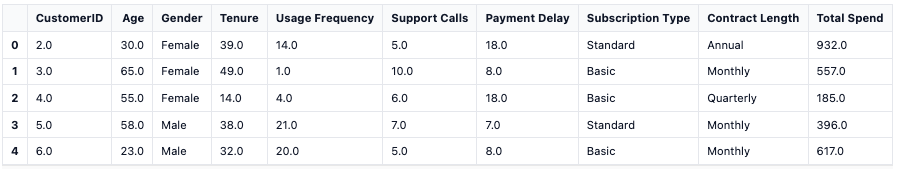
In this dataset, each row represents a customer. Some have left, while others are still active. Our job as analysts is to figure out what separates them. Is it age? Payment habits? Support usage? Subscription type?
This is where all data work begins: curiosity about the business turns into structured exploration.
Step 2: AI-Assisted Data Exploring and Preparation
Before we think about models, we need to look at the data. As we say in look the data: raw tables don’t speak, they need to be visualized.
Traditionally, this means writing a dozen lines of matplotlib or seaborn just to get a few bar charts.
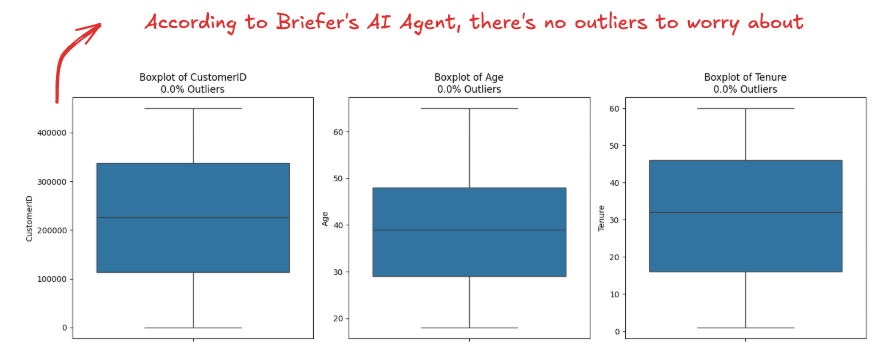
With Briefer, you can just ask: "Are there any outliers in the dataset?" to the AI agent. It scans the distributions and flags any extreme or unusual values—say, users with hundreds of support calls or negative payment delays. It gives us the useful graphs like these boxplots for outlier detection:
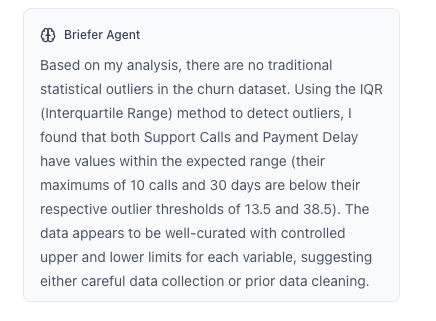
For when you're in a hurry, there's also a resume of what it found:
What makes Briefer powerful is that this isn’t a one-shot command. You can iterate with the AI: refine the question and drill down into specific segments. The agent also helps in prepping the dataset:
- It can drop irrelevant columns (like CustomerID).
- Flag and encode categorical variables (like Subscription Type).
- Suggest transformations, like turning Last Interaction into "days since last login".
- And even surface early signals—like: "Churn is 2.4x higher among users with monthly contracts and more than 5 support calls."
This insight is not just an observation. It becomes a cornerstone for modeling.
Step 3: Obtaining Insights from the Data
Say in the last step, when asking to compare the churn rate by contract length, you actually got somethig interesting that can be turned into insight:
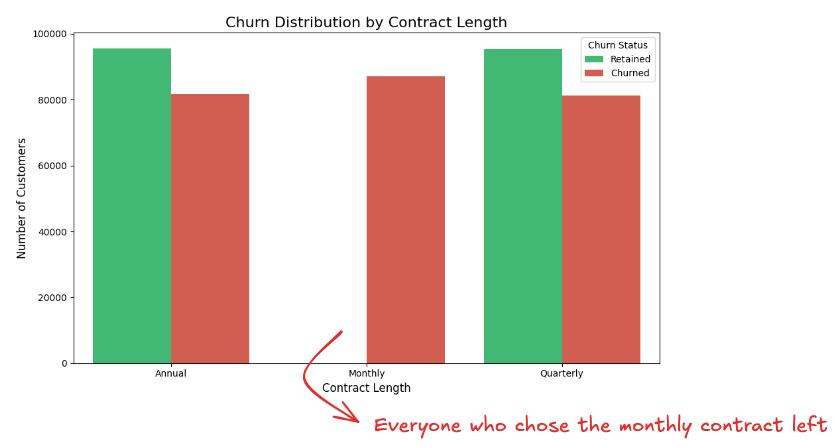
We discovered that 100% of customers on a monthly plan churned. What was just a statistic is now a story.
We can go even further and ask
- Why are monthly users leaving?
- Are they younger? Using the product less?
- Are they contacting support more often?
This insight is not just an observation, it becomes a cornerstone for modeling, which would be the next step here. Choosing a model and deciding its features would be the next natural step here; knowing that for example if we're using something like logistig regression, we can include Contract Length as a categorical feature, can then assign a high weight to the "monthly".
Things to Be Careful Of
Sure AI tools for data analysis can make work faster, but they can also make mistakes faster if your data foundation is shaky. Here are the most common traps, and how to avoid them:
Mind the Semantics
Just because a column is named "status" doesn’t mean it means what you think it means. Maybe it means "active billing", or "signed in this week."
When AI agents or text-to-SQL tools generate queries, they’re guessing based on the names and sometimes the stats, not your business rules.
The solution? Semantic modeling, a task that often involves close collaboration between data engineers and data analysts.
Tools like DBT let you define your business logic in code:
- "Active" means: last_login < 30 days AND subscription = active
- "Churn" means: canceled_at IS NOT NULL OR no activity in 90+ days
This is critical for using AI responsibly. When Briefer connects to your metrics layer or DBT models, it treats these definitions as source of truth. Every answer from the AI agent is grounded in your actual logic, not assumptions.
And just like in DBT, you can add column or table-level docs directly in Briefer to help the agent understand what each field really means. This gives the AI richer context for analysis, improves query accuracy, and ensures that when you ask a question, it is answered correctly.
Beware of Duplicate Data
One of the most common ways to get a wrong answer, especially when using AI tools, is to ask a simple question across two tables that look the same but actually aren’t.
Imagine this: you want to know how many users does a platform have right now. You find two different tables A and B:
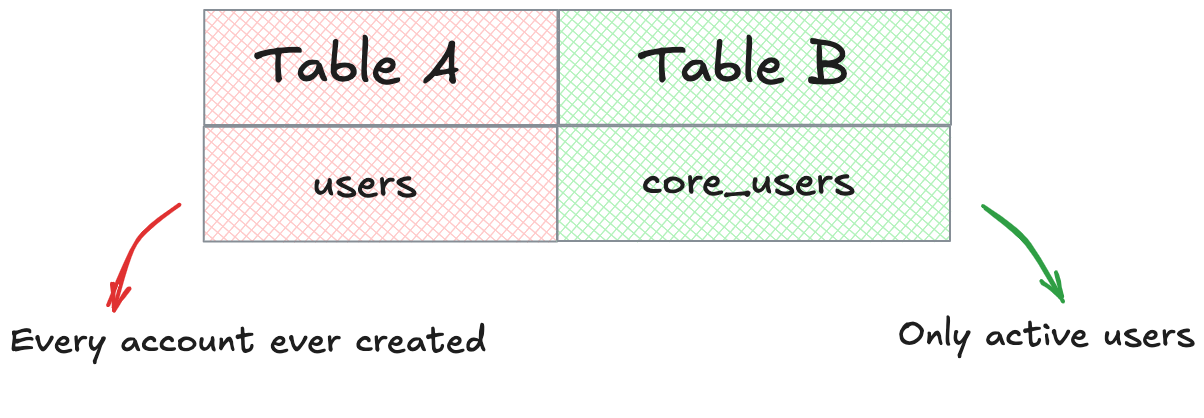
In A, users mean every account ever created, even test accounts, trials, and soft-deleted users. In B, core_users include only active, paying users that matter for real reporting. They look similar but aren't.
Both have a user_id, and both are in use somewhere. But querying each gives you different results, and different definitions of "user". Briefer, or any AI agent is unable to infer which one represents your team's actual logic. And if your teammates disagree about which table to use, that inconsistency will surface in every report and dashboard.
To avoid that, ground every core concept (users, subscriptions, transactions) in a single table with explicitly defined structure. This is the role of a source of truth: a statement of intent. It says: This is what we mean when we talk about a user.
Once that’s established:
- Make it clear what the table includes and excludes. Does it count trials? Does it filter out test accounts? Is it updated hourly or weekly?
- Store that meaning close to the data; ideally as a DBT model description or metadata field.
- Retire the leftovers. Outdated, forked, or redundant tables create drag. They multiply interpretations, not insights.
Ambiguity is solved simply by clearer definitions.
Don't Let Your Dashboards Rot
A common failure mode: a company builds dozens of dashboards with overlapping or unclear purposes. Months later, no one knows who owns them, what the filters mean or whether they reflect current data. What happens next is obvious: someone asks a question and the wrong dashboard gives the wrong answer.
Outdated dashboards waste space and cause confusion. The fix is:
- Identifying which dashboards are still used and archive the rest.
- Label trusted ones clearly.
- Don’t rely on static dashboards for critical answers, use tools like Briefer that generate queries from source data in real time.
Dashboards should reflect what matters now, not what mattered three quarters ago.
Agree on What Matters Before You Measure It
Your AI assistant is only as useful as your shared understanding of what to ask. If one team cares about weekly active users while another tracks returning logins, you’ll get different answers.
This is where semantic alignment is just as important as technical setup. You want to document what a key metric means, how it’s calculated and when it’s relevant
Briefer supports this by letting you annotate columns, define business metrics, and even sync from DBT. So when someone asks "What’s our churn rate?" they’re not inventing a new one every time, they’re accessing the right one.
FAQ for Practitioners
Whether you're a data analyst, product manager, or engineer experimenting with AI for analysis, these are some of the most common questions that come up once you're past the basics.
"Can I use AI to help build predictive models?
Yes. You can use Briefer’s AI agent to explore the dataset, identify high-signal features and even suggest a model type based on your objective. You’re still responsible for evaluating the model, but the AI can accelerate the process and catch early signals you might miss.
How does this differ from using ChatGPT or a code assistant like Cursor?
Briefer connects to your actual data and metadata. It knows what tables exist, what the columns mean, and how your metrics are defined. Assistants like ChatGPT or Cursor can scaffold a model, while Briefer can help answer specific questions about your data and generate SQL or Python with awareness of schemas, types, and access controls.
Can I use AI for both quantitative and qualitative analysis?
Yes. The two are not mutually exclusive—and using both helps tell a more complete story. We talk more about it in Leveraging AI for Quantitative and Qualitative Analyses
Can I Use AI for Data Visualization?
Yes, using generative AI for data visualization it's a common task you can do with Briefer's AI Agent.
What if my data is messy or not well documented?
You’ll still get answers, but they may be misleading. The value of AI increases with the clarity of your schema. That’s why Briefer works best when synced with a semantic layer like DBT or with annotated metadata: it helps the AI interpret your intent correctly.
Should I Use Python or SQL for Data Analysis with AI?
Depends on your goal. Check Python vs SQL for Data Analysis to understand when it's better to stay in SQL, and when it's smarter to switch to Python.
How to do Exploratory Data Analysis with AI?
You can read our full guide on Exploratory Data Analysis with AI.
How can I learn more about AI for data analysis?
You can read our full guide on how to learn AI for data analysis.
When should I move from exploration to modeling?
When you’ve found a pattern that explains a real outcome (like churn rate being highest for monthly users with high support calls) and you want to predict that outcome for others.
The whole point of using AI for data analysis is to reduce the gap between a question and an answer. The more precisely your data is modeled and your metrics defined, the more powerful these tools become.
AI won’t replace your judgment. It amplifies it. The better your foundation, the further you can go.