Since the very first day we launched Briefer, we had a strong hunch that dashboards would be something people would want. We were right. We've been getting a lot of requests for this feature, and we're happy to announce that it's finally here.
Along with dashboards, we've also made some improvements to our visualizations and AI assistant. Here's what's new.
Dashboards
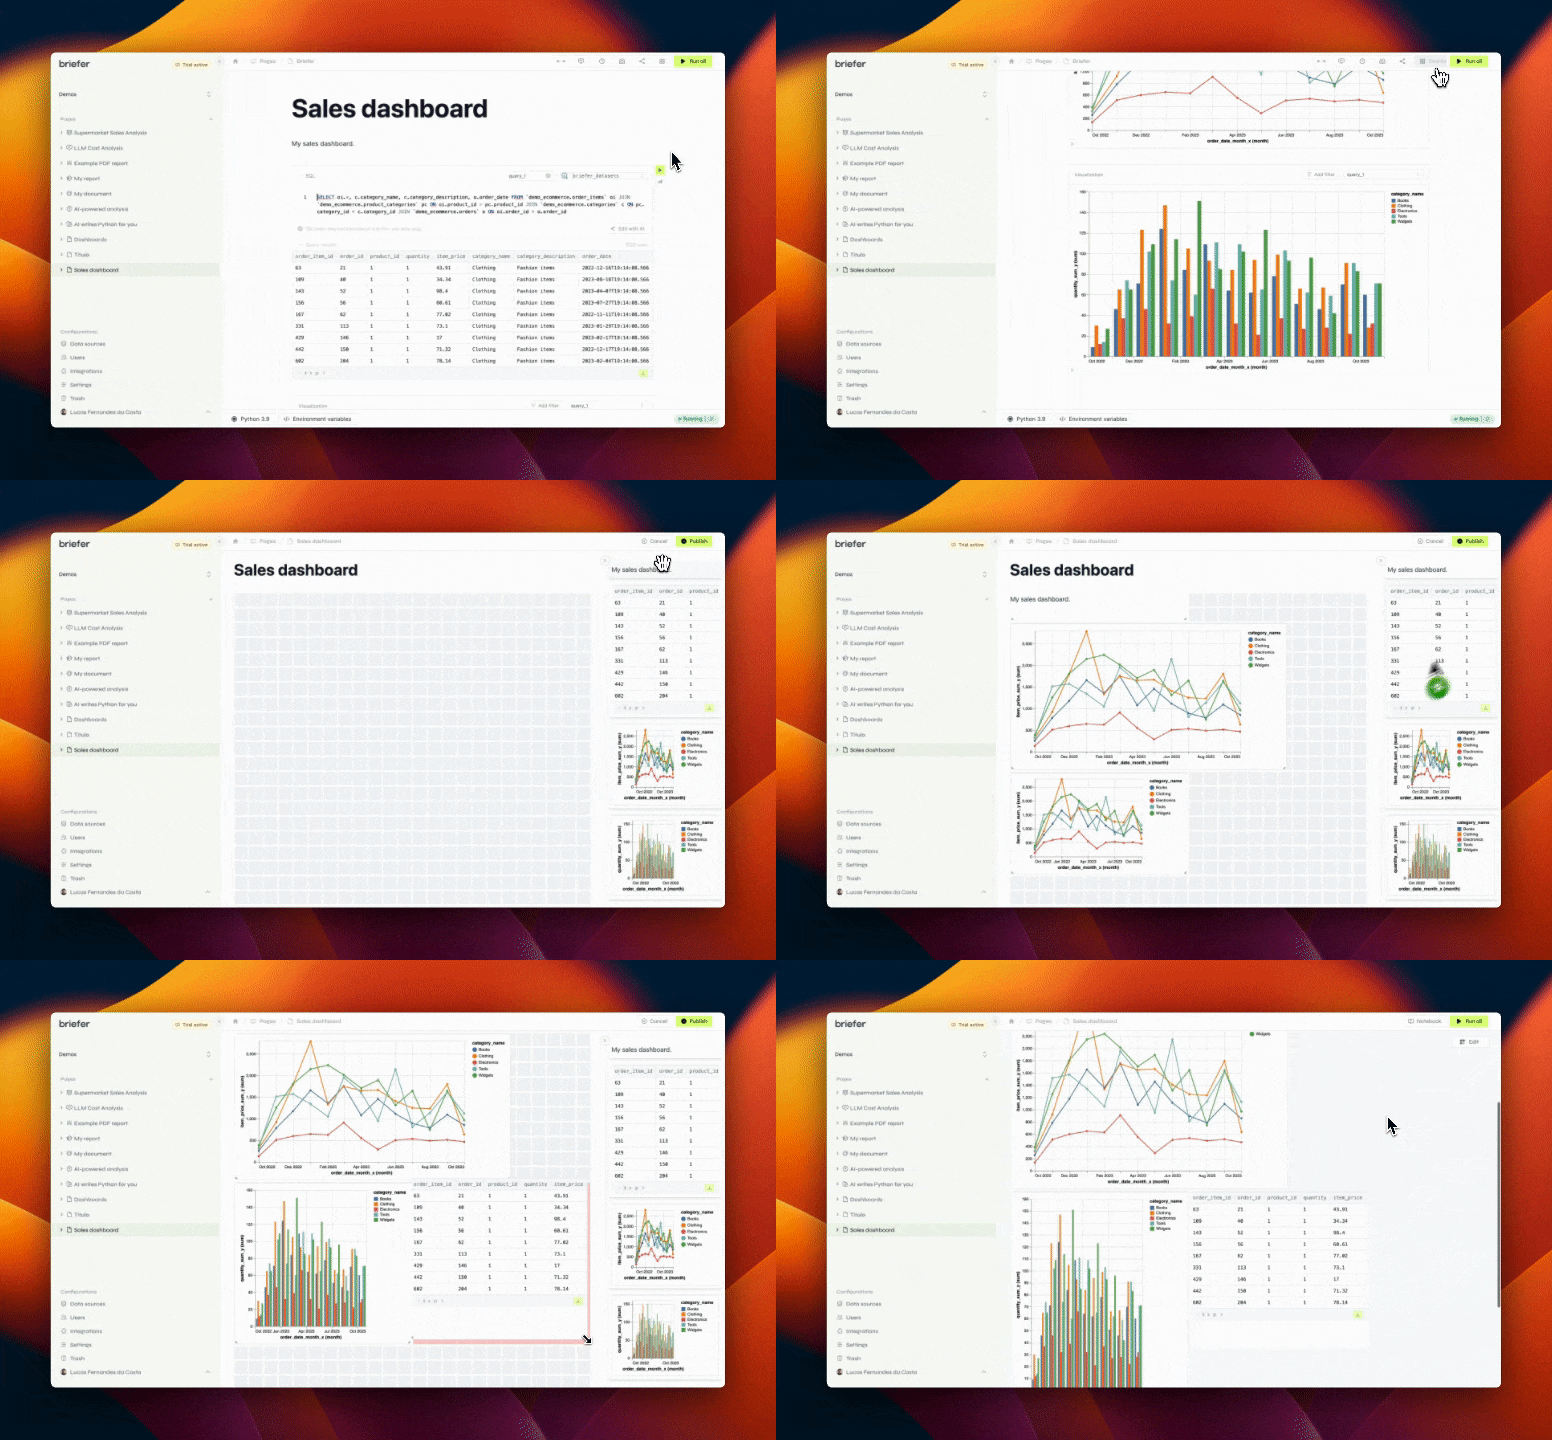
You can now turn your notebooks into dashboards. Dashboards are a great way to keep track of your most important metrics and KPIs in one place. You can add multiple visualizations to a dashboard, rearrange them, and resize them to fit your needs.
At Briefer, we care a lot about empowering users to do whatever they want with their data, that's why our dashboards support Python outputs. You can use Plotly, Seaborn, or any other Python library to create your visualizations and add them to your dashboards.

To create a dashboard, click the "Dashboards" button on the upper-right corner of the editor. Then, drag and drop the blocks you want to add to the dashboard.
You can also resize each block by dragging the bottom-right corner of the visualization.
Once you're done, click the "Publish" button to save your dashboard. You can access it at any time by clicking the "Dashboards" button on the upper-right corner of the editor.
Please notice that you will need to republish your dashboard every time you make changes to the blocks if you want to see them reflected in the dashboard.
Better visualizations
To go along with the new dashboards feature, we've also made some improvements to our visualizations.
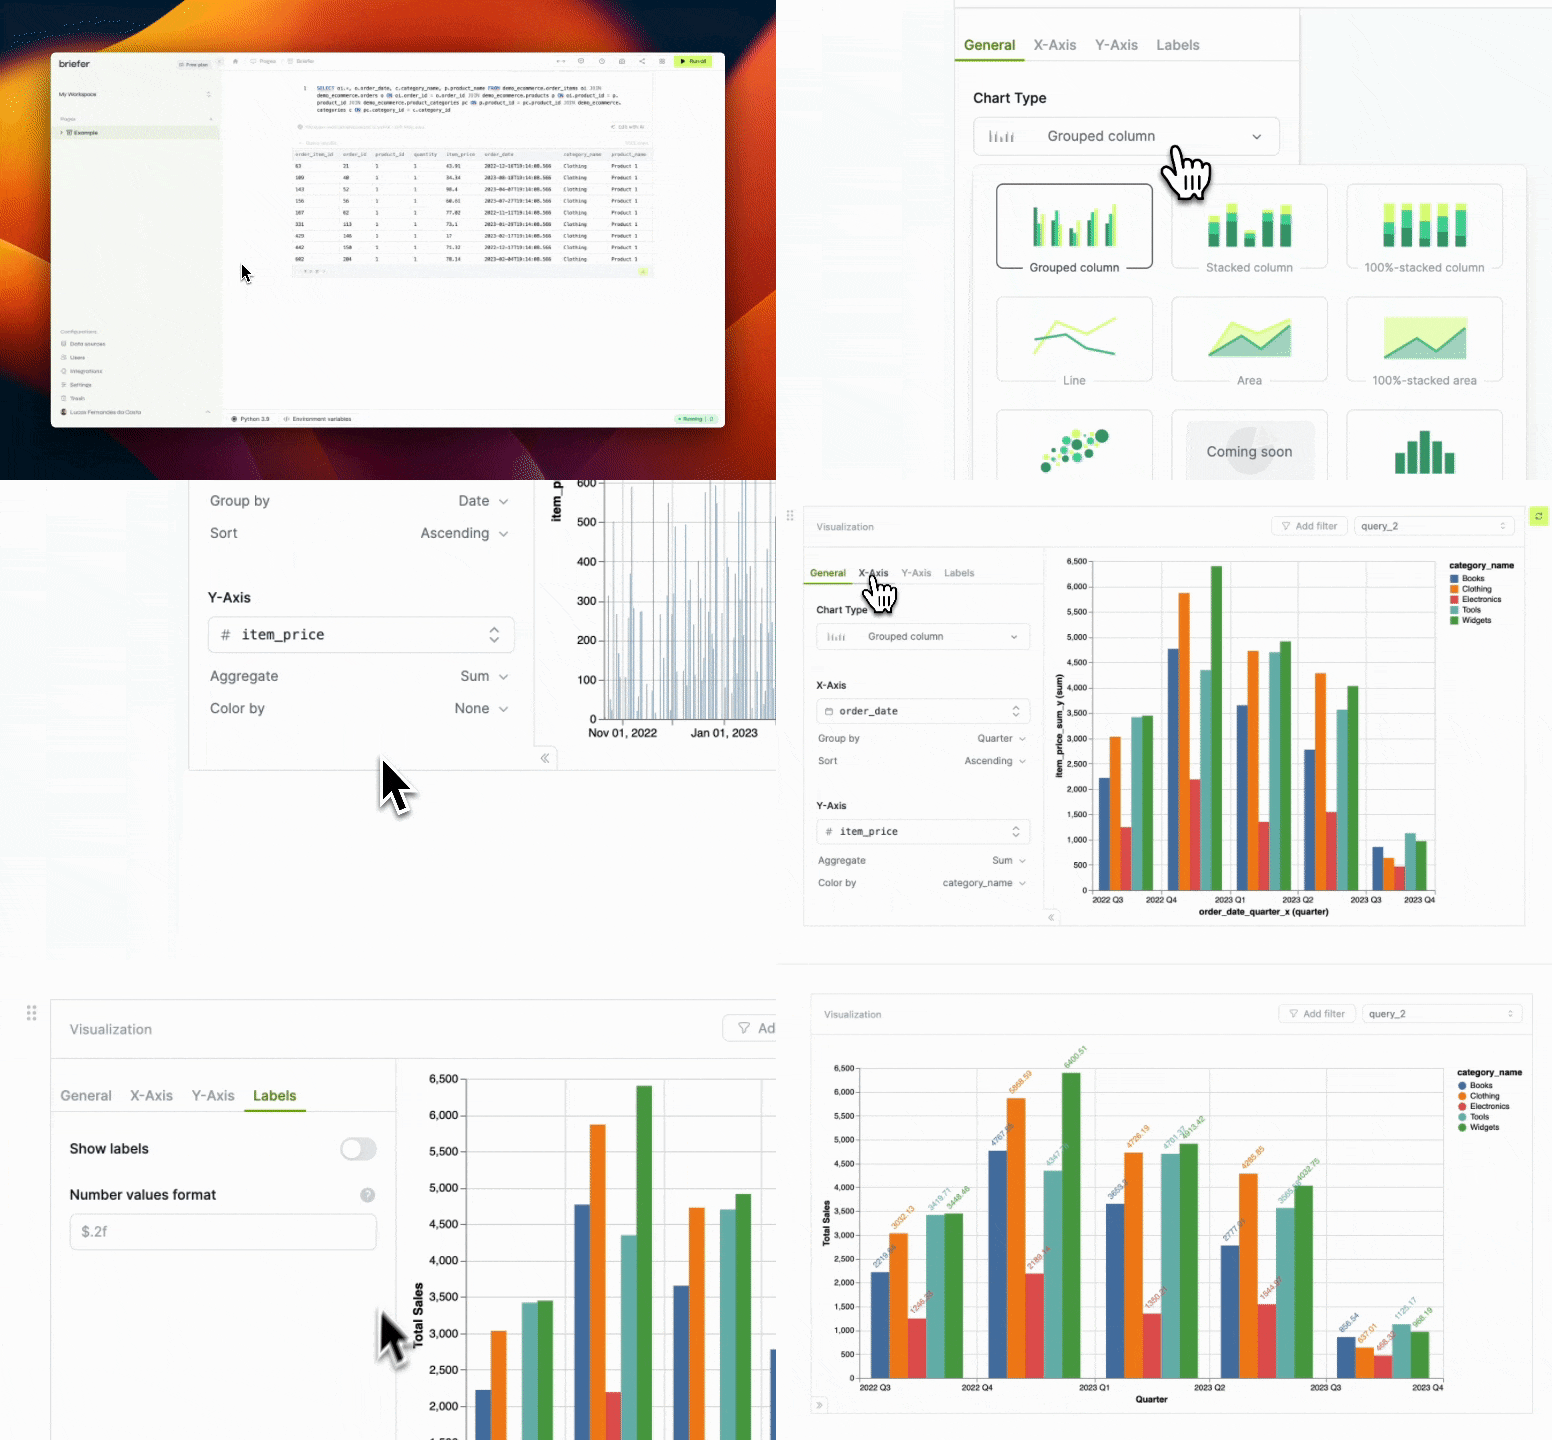
You can now rename each axis in your visualizations, format the value displays, and choose whether to display the labels or not.
We've also added support for histograms.

Better AI
Our SQL and Python AI assistant has also received some updates. It's now better at understanding your questions and providing relevant answers.
We've also had a few users ask for a way to change the foundational model of the AI assistant. Now, you can do that by clicking the "Settings" button on the lower-left corner of the editor, and then selecting the desired foundational model to use.
General Improvements and Bug Fixes
- We now support Athena and Oracle databases as data sources.
- There's now a complete onboarding guide for new workspaces. It includes instructional videos and tips to help you get started.
- We've improved the Slack integration so that it's easier to set up, especially when it comes to channel selection.
- The schedules list now shows the notification settings for each scheduled run.
- We've updated the notification settings so that it can send PDF attachments containing your documents.
- Copying and pasting an image into a text block will now work as expected.
- There's a clearer indication of each user's tier right next to the logo on the top-left corner of the app.
- There's now a "Create visualization" button on the right of each SQL block. Clicking it will create a new visualization block with the results of the SQL block.
Besides those changes, we've done a variety of bug fixes and small performance improvements.
