
In the past few weeks, we've got plenty of requests for "quality of life" features, so we delivered them.
This week, we're glad to show you how to use new dashboard features, connect MySQL databases, and query uploaded files using plain SQL.
Many people asked for context-aware autocomplete in SQL and Python blocks, so we shipped that too.
Querying files
You can now write SQL queries against files and dataframes. This means you can upload a CSV file and query it using SQL, for example.
To do that, add a "File Upload" block, drag your files into the block, and then click the "query" button to generate an example SELECT * FROM query.
Feel free to change that query to do whatever you want with the data in the file.
In addition to querying files, you can also query any pandas dataframes, as you can see in the example below.
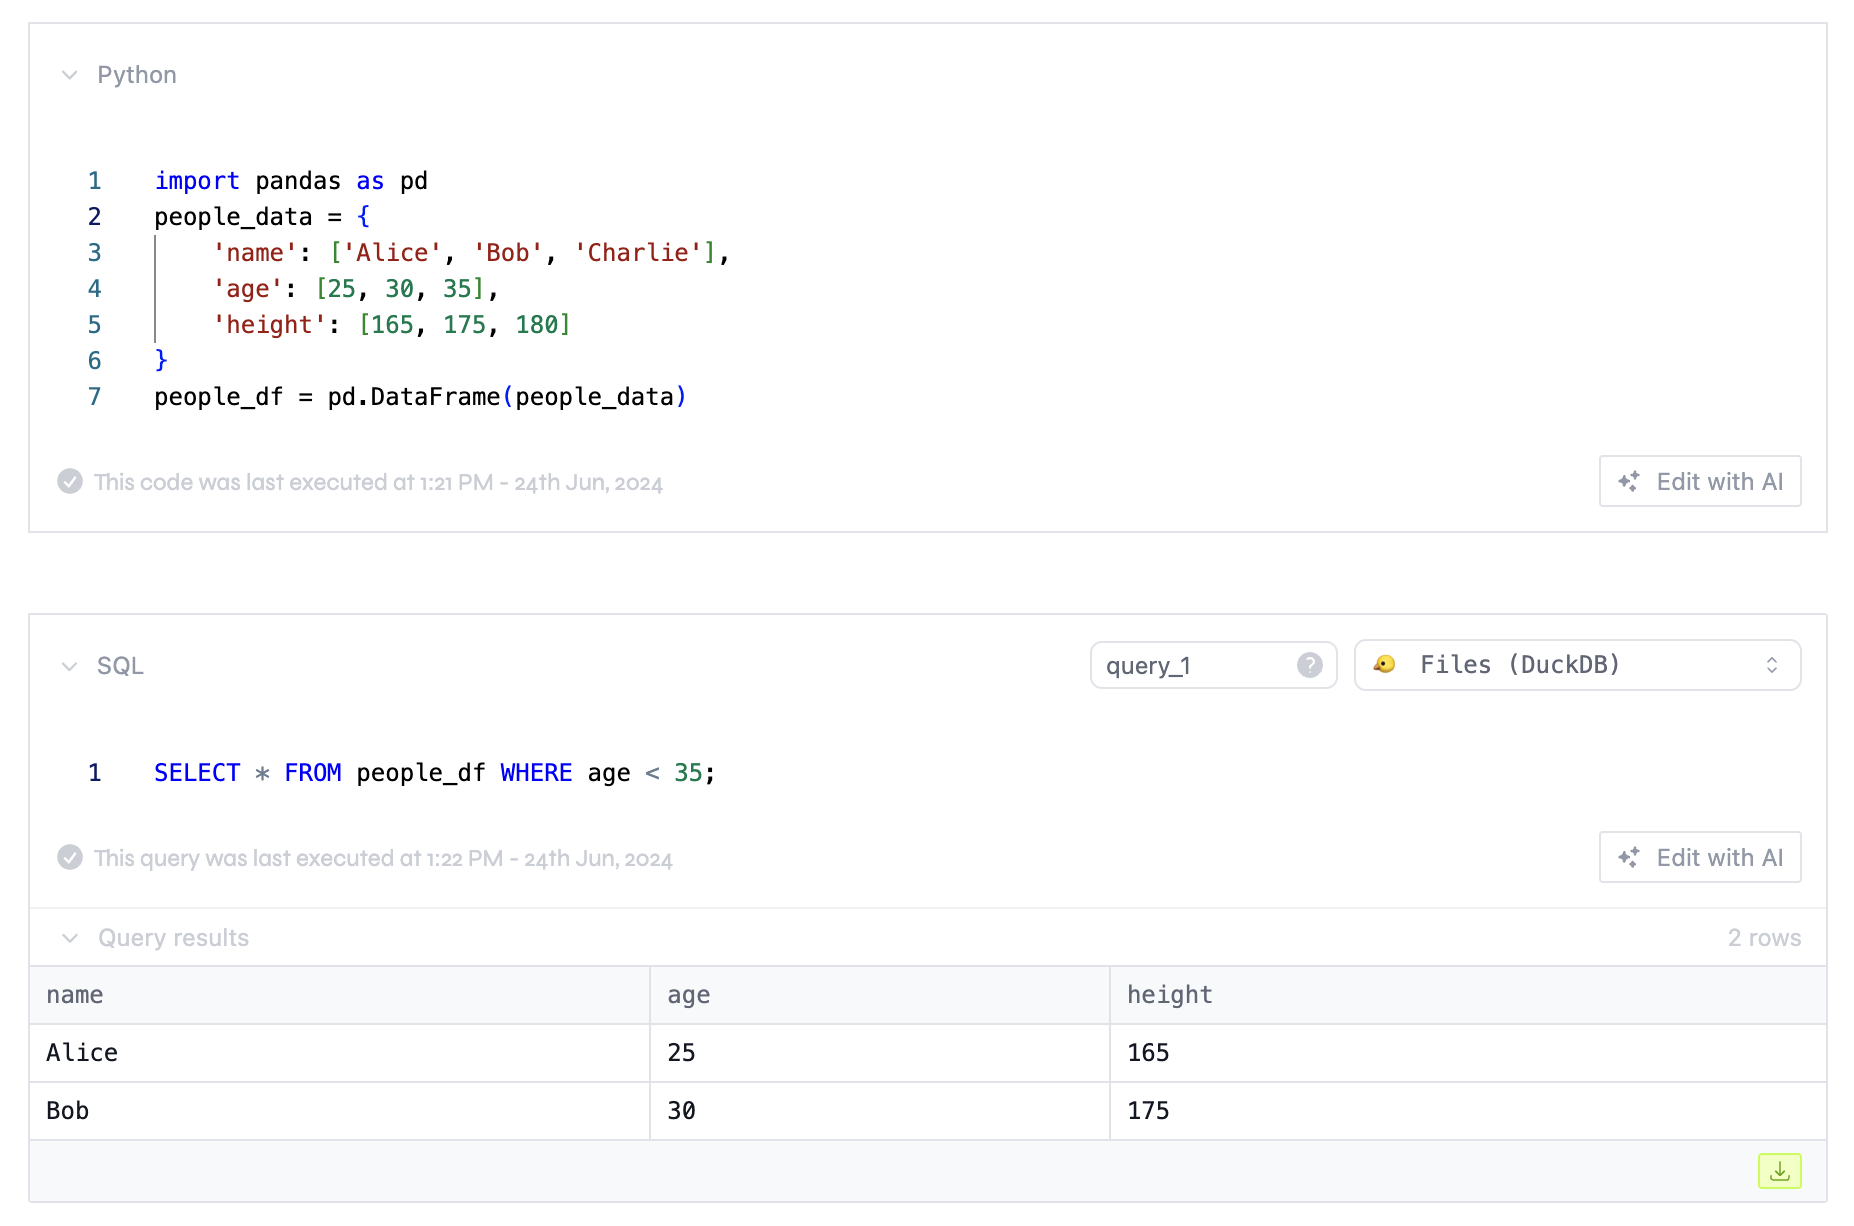
As a general note, you should select the Files (DuckDB) data source whenever you want to query anything other than a database.
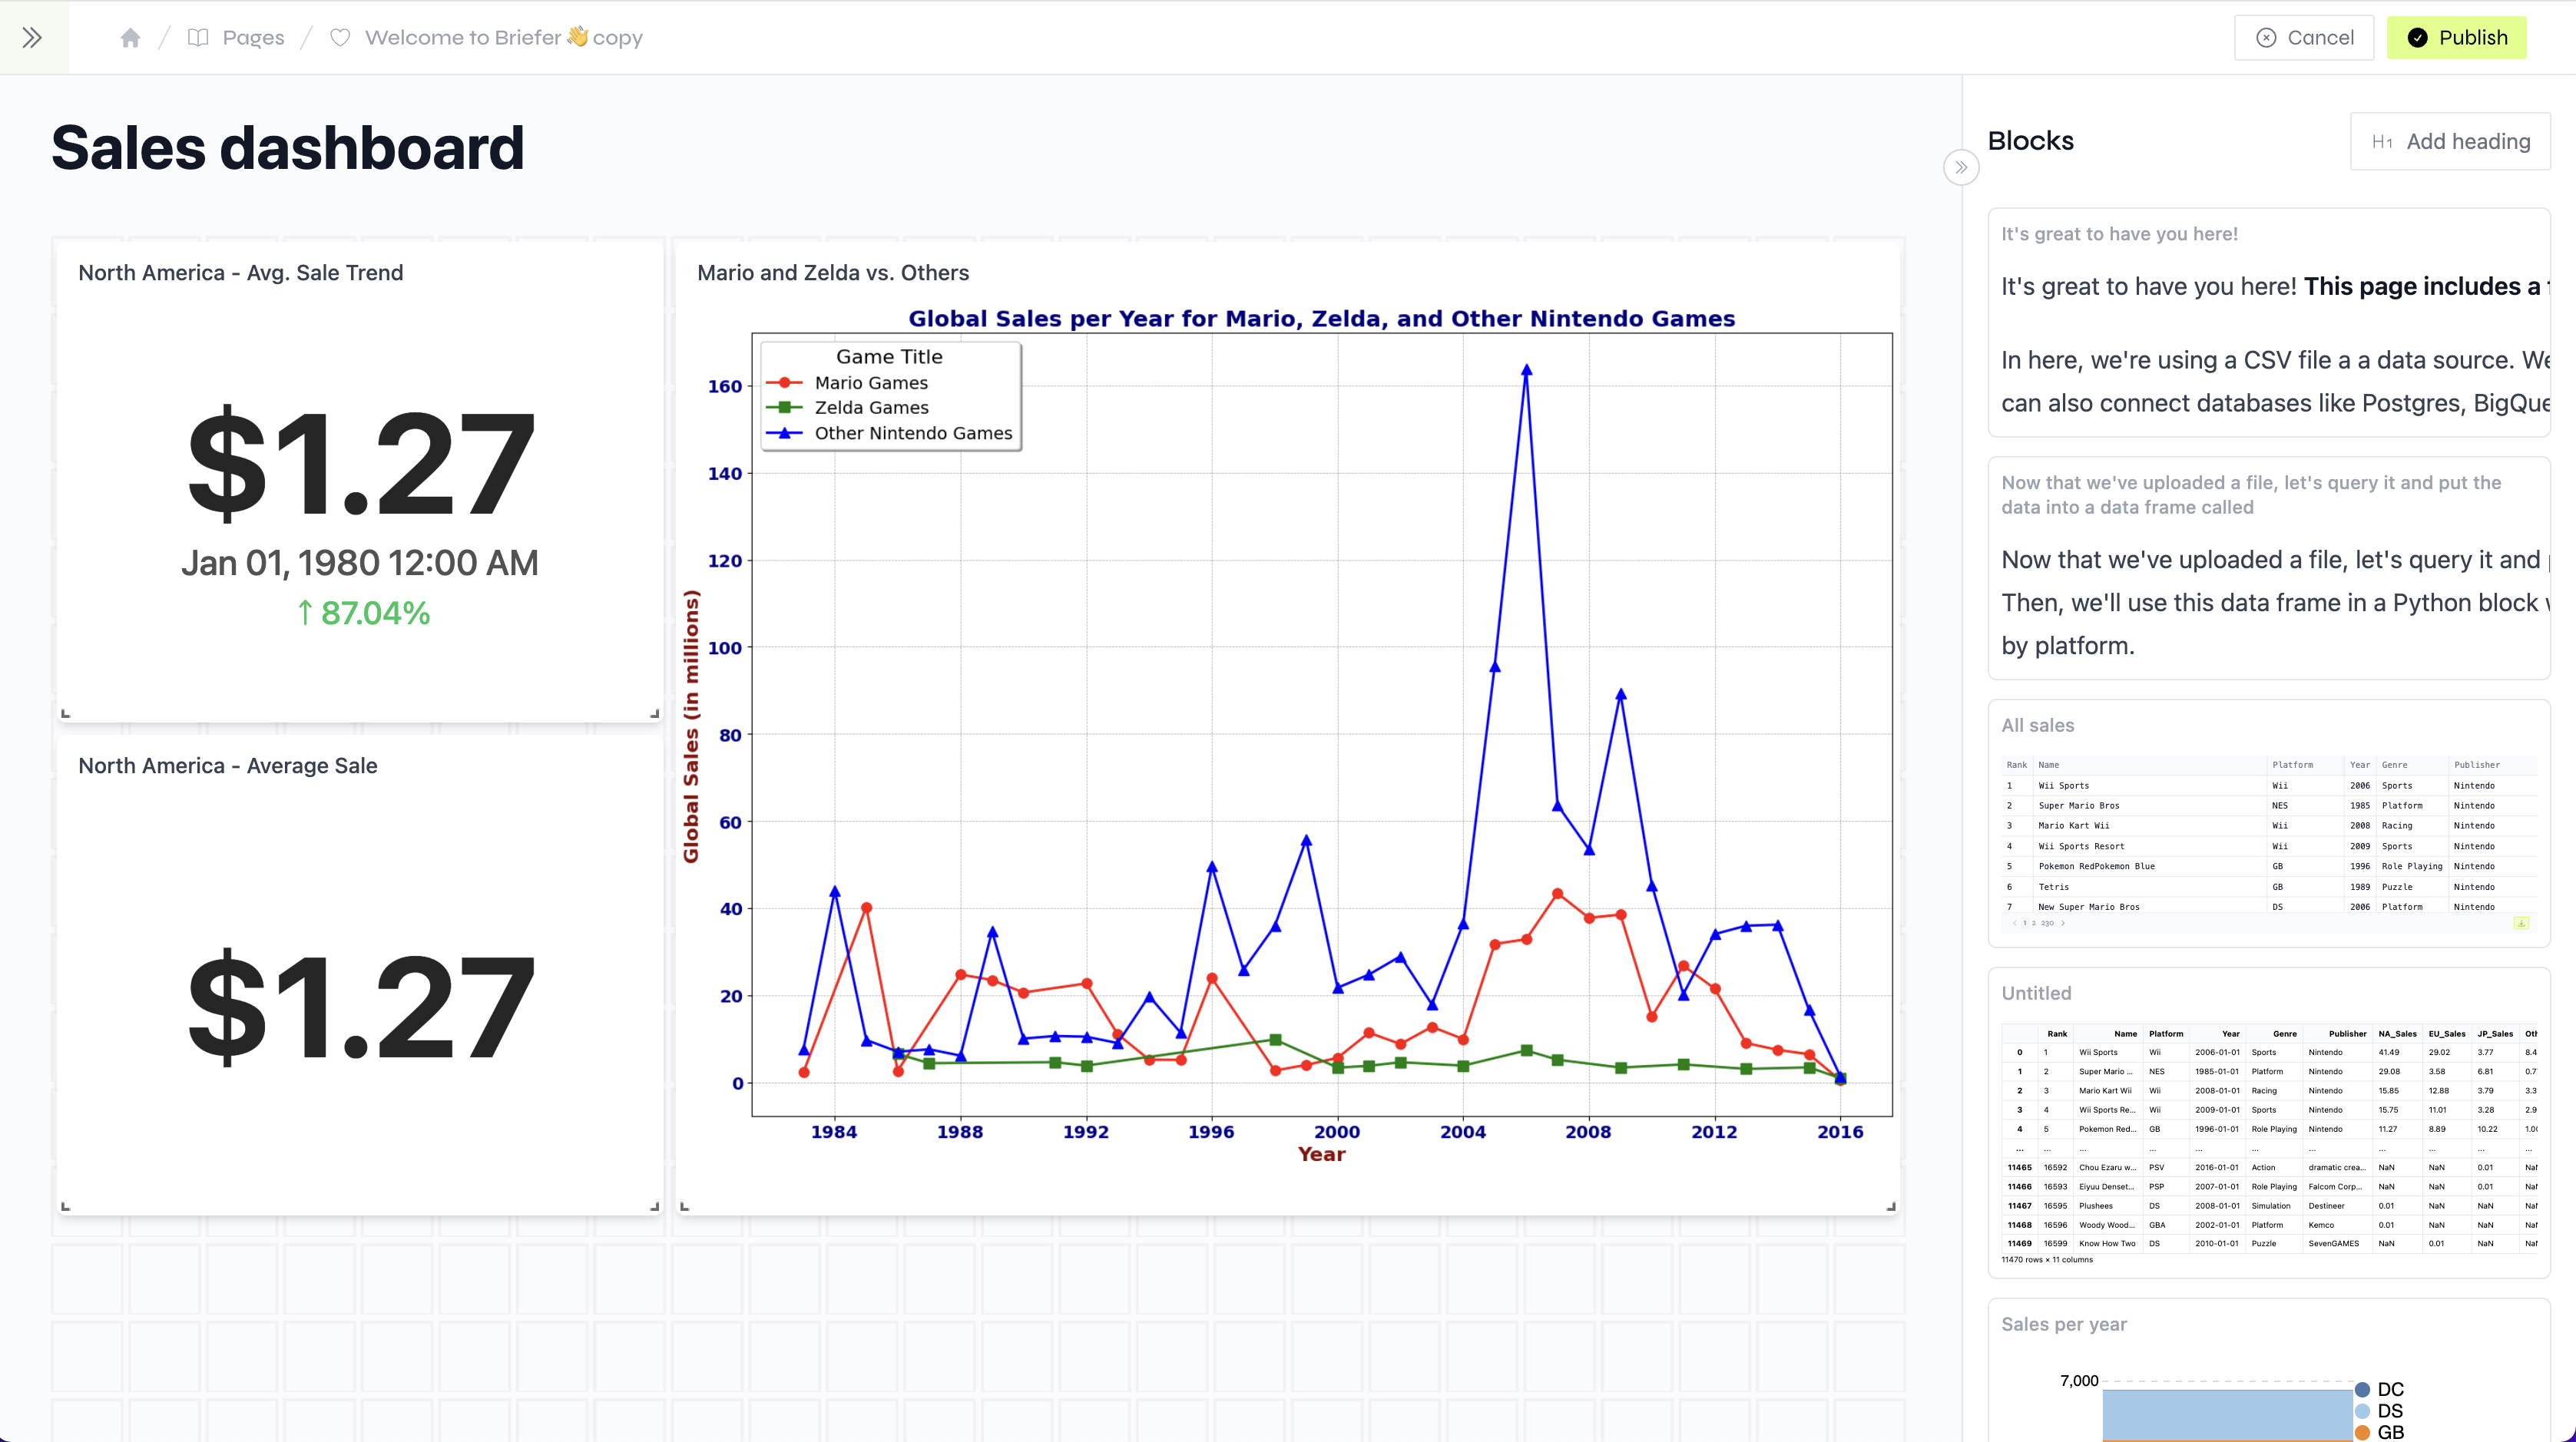
Better dashboards
We did tons of changes to the aesthetics of dashboards, but we're not done yet.
In the past few weeks, we cleaned up the visualization display, added support for data labels, and also improved the way all blocks look in the dashboard.
Additionally, blocks now show their titles on the top left corner, and the sidebar has been completely revamped so all blocks look nice within it, and so you can see their titles. That way, it's easy to identify what each block is doing at a glance.
Dashboard headings
Headings can help you organize your dashboard's content. You can add a headding to any block by clicking the "Add Heading" button on the top right corner of the block list.
These headings will only appear in the dashboard view, not in the notebook.
New visualization types
In addition to the aesthetics, we've also added a few new visualization types, such as "trend" and "numbers".
The "trend" visualization is great for showing trends over time, while the "numbers" visualization is perfect for highlighting a single metric in a large font.
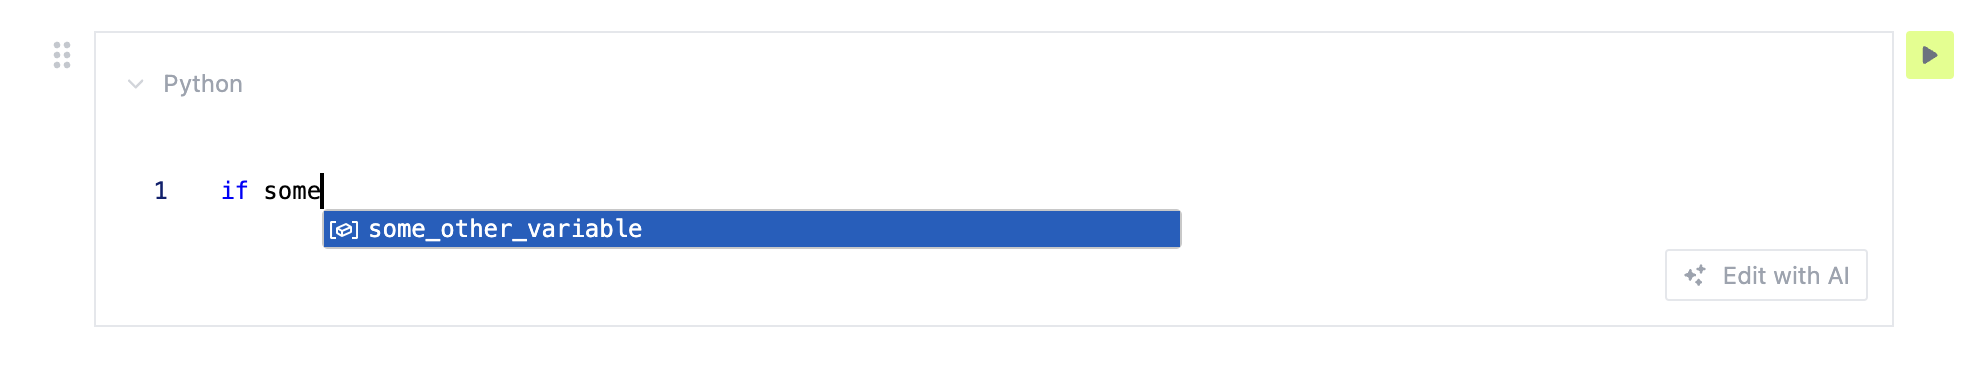
Autocomplete
We've added autocomplete to SQL and Python blocks. This means you can now get suggestions for column names, table names, variable names, and functions while writing your queries.
Please note that for the SQL autocomplete to work, the permissions of the user you're using to connect to the database must allow for querying the information schema.
MySQL support
We've added support for MySQL databases. You can now connect to a MySQL database and query it using SQL blocks.
General Improvements and Bug Fixes
- It's now possible to undo AI suggestions and try them before accepting the diff.
- There's a new onboarding document that will help you get started with Briefer when creating new workspaces.
- Visualizations now support multiple Y-axes.
- Document's titles will now appear in the browser's tab.
- We fixed a bug in which the line chart would offset ticks in the X-axis.
- We fixed a bug in which the "in/not in" filters would not work for dataframes.
- We fixed a bug in which the blocks would be repositioned when opening the sidebar.
- We fixed a bug in which the progress indication would show incorrect values when running entire notebooks.
- We fixed a bug where invalid visualizations would fail silently and not show any error messages.