Speed kills rigor. In startups, the pressure to ship fast pushes teams to report anything that looks like an improvement. That’s how p-hacking happens. This piece breaks down three common cases—and how to avoid them.
Example 01: Multiple comparisons without correction
Imagine you're a product manager trying to optimize your website’s dashboard. Your goal is to increase user signups. Your team designs four different layouts: A, B, C, and D.
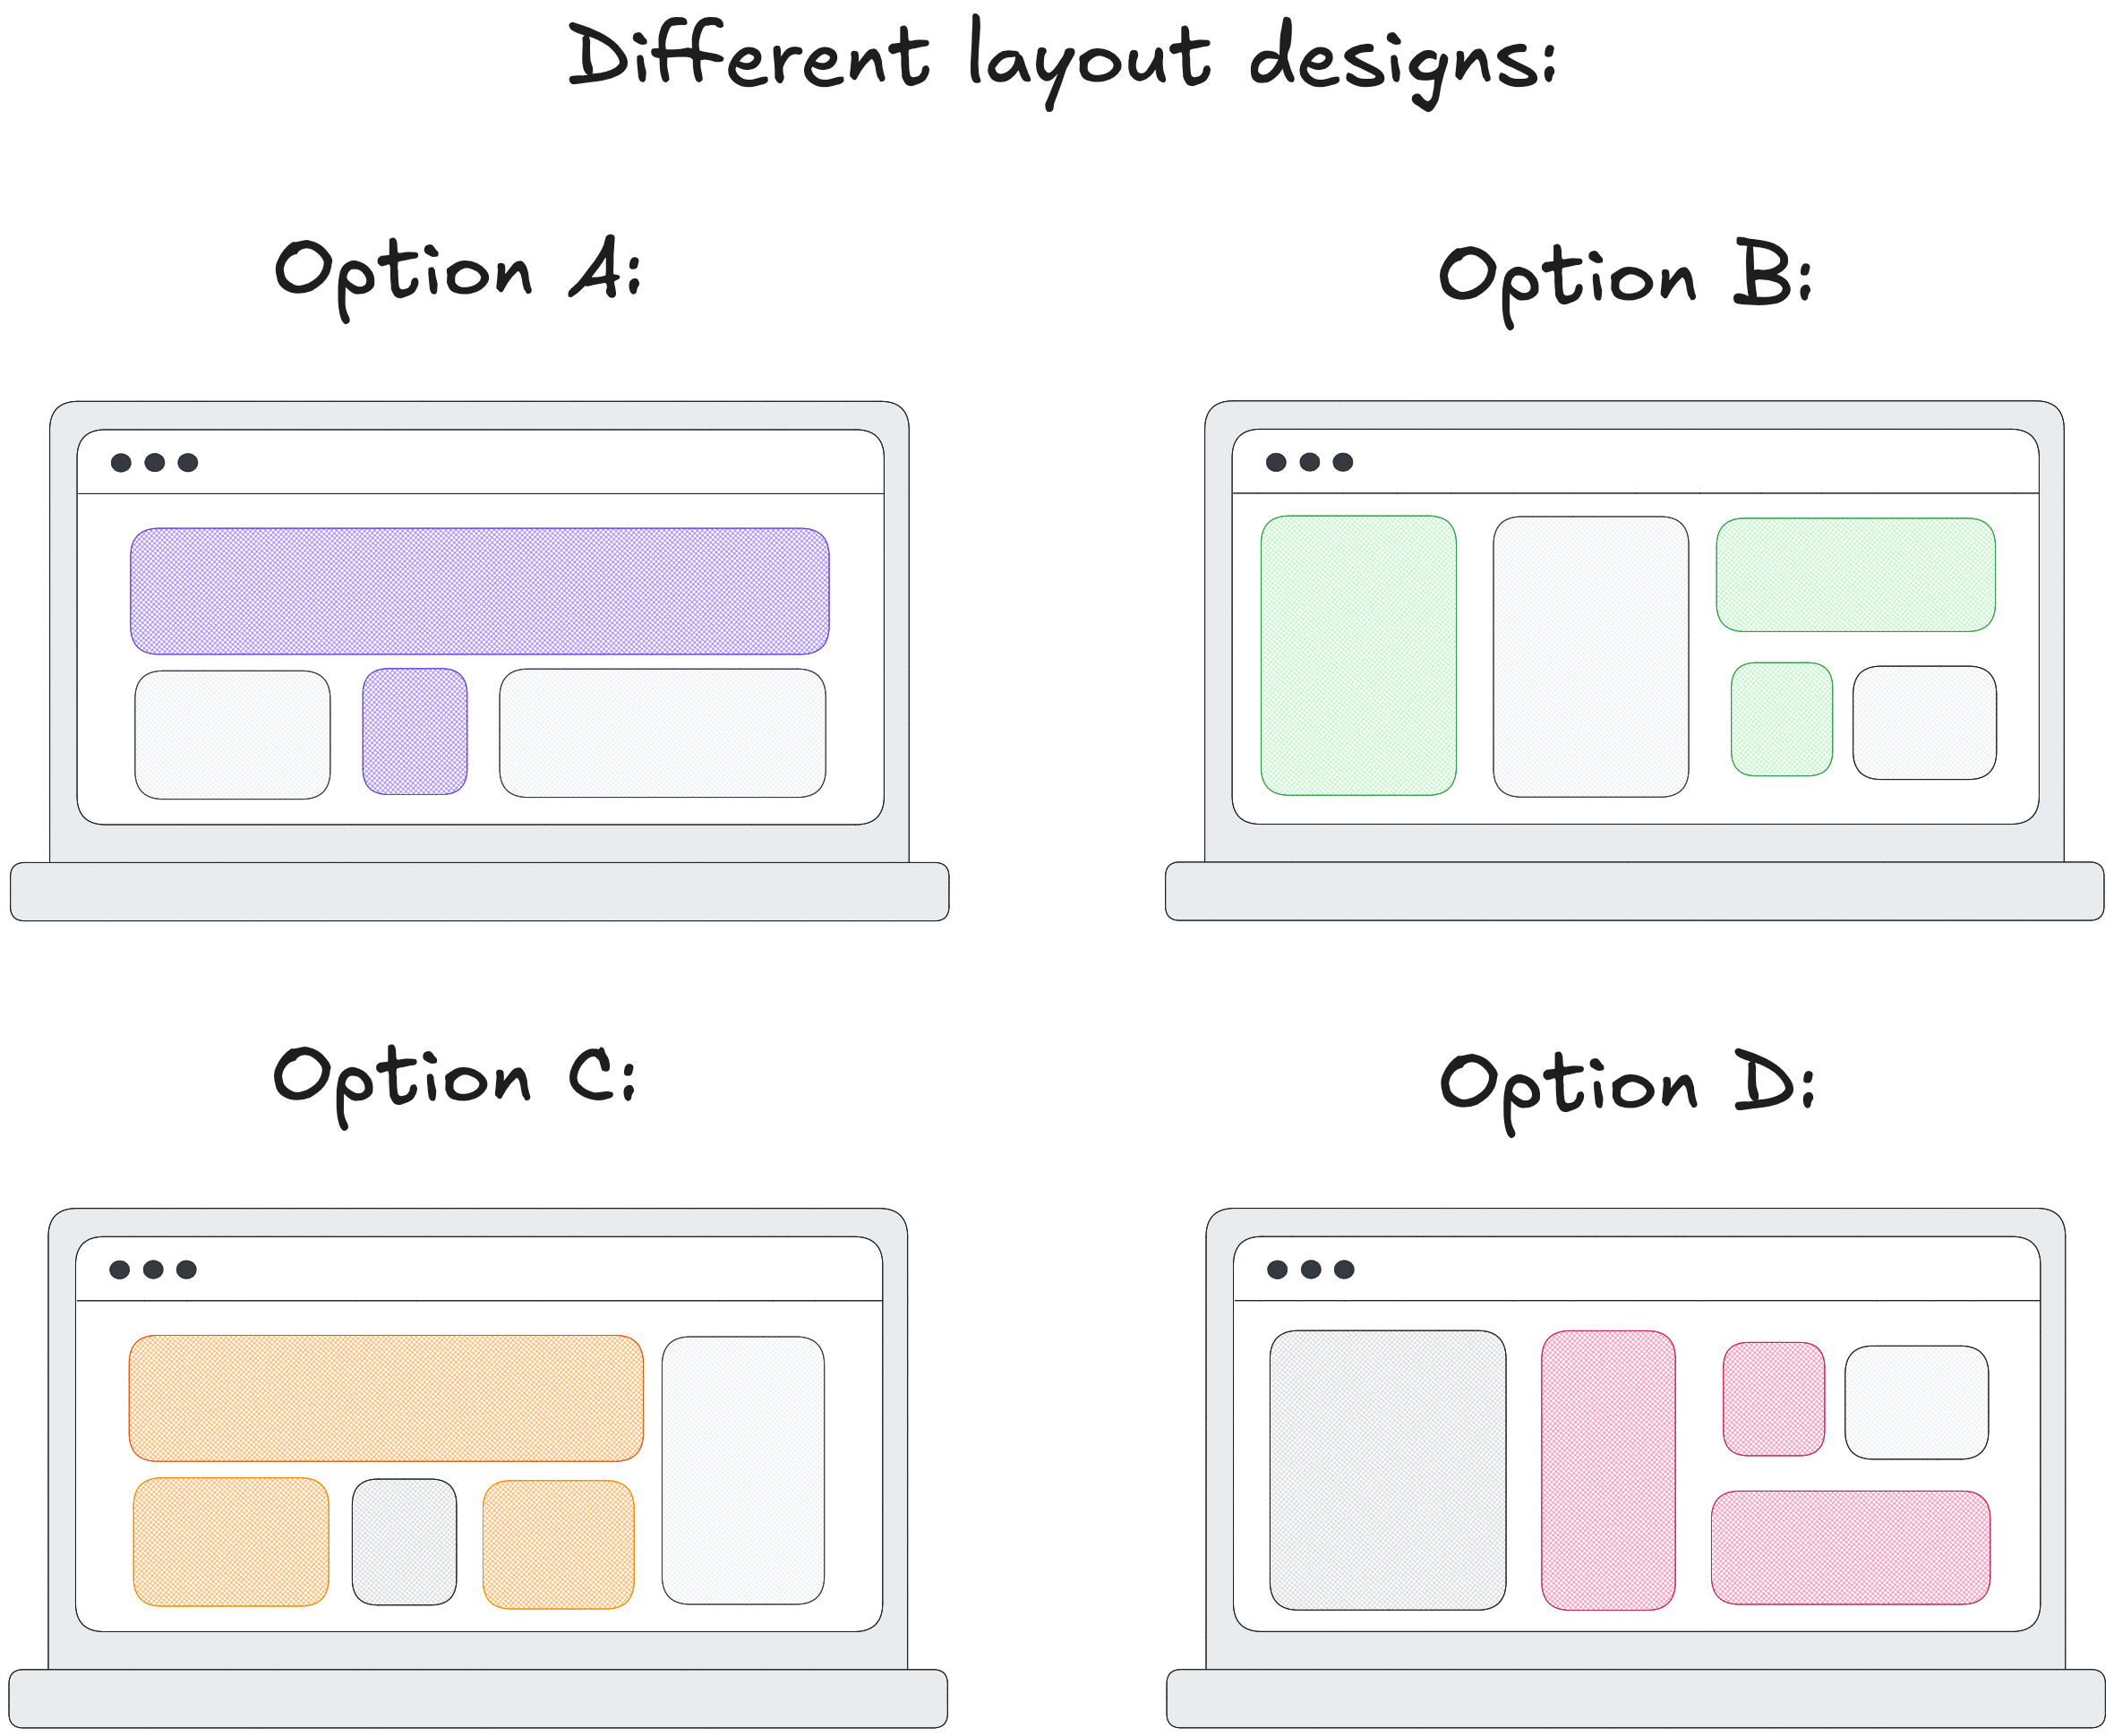
You run an A/B/n test. Users are randomly assigned to one of the four layouts and you track their activity. Your hypothesis is: layout influences signup behavior.
You plan ship the winner if the p-value for one of the layout choices falls below the conventional threshold of 0.05.
Then you check the results:
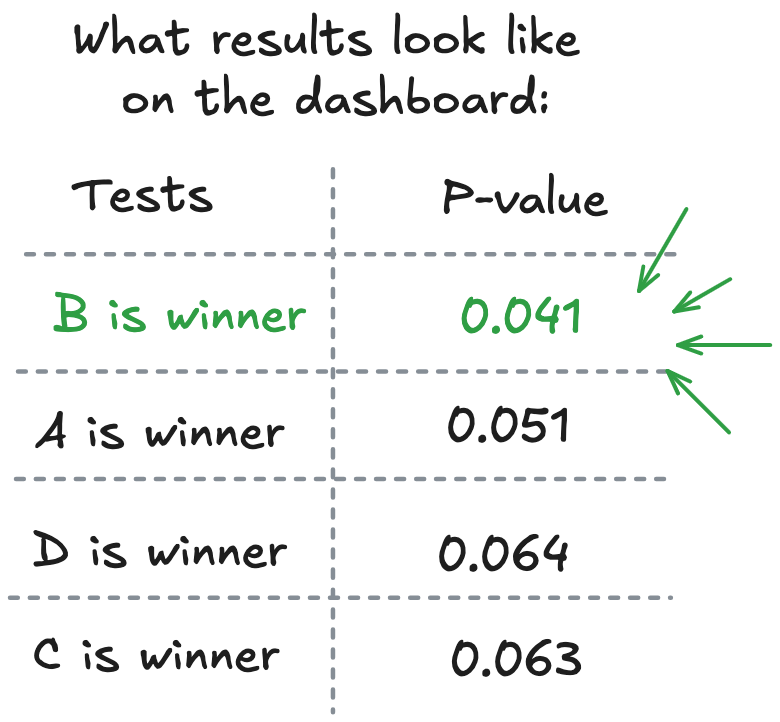
Option B looks best. p = 0.041. It floats to the top as if inviting action. The team is satisfied and ships it.
But the logic beneath the 0.05 cutoff is more fragile than it appears. That threshold assumes you’re testing a single variant. But you tested four. That alone increases the odds of a false positive.
Let’s look at what that actually means.
Setting a p-value threshold of 0.05 is equivalent to saying: "I’m willing to accept a 5% chance of shipping something that only looked good by chance."
So the probability that one test doesn’t result in a false positive is:
Now, if you run 4 independent tests, the probability that none of them produce a false positive is:
That means the probability that at least one test gives you a false positive is:
So instead of working with a 5% false positive rate, you’re actually closer to 18.5%: nearly a 1 in 5 risk that you're shipping something based on a fluke.
And that risk scales quickly. The more variants you test, the higher the odds that something looks like a win just by coincidence. Statistically, the probability of at least one false positive increases with each additional test, converging toward 1 as the number of comparisons grows:
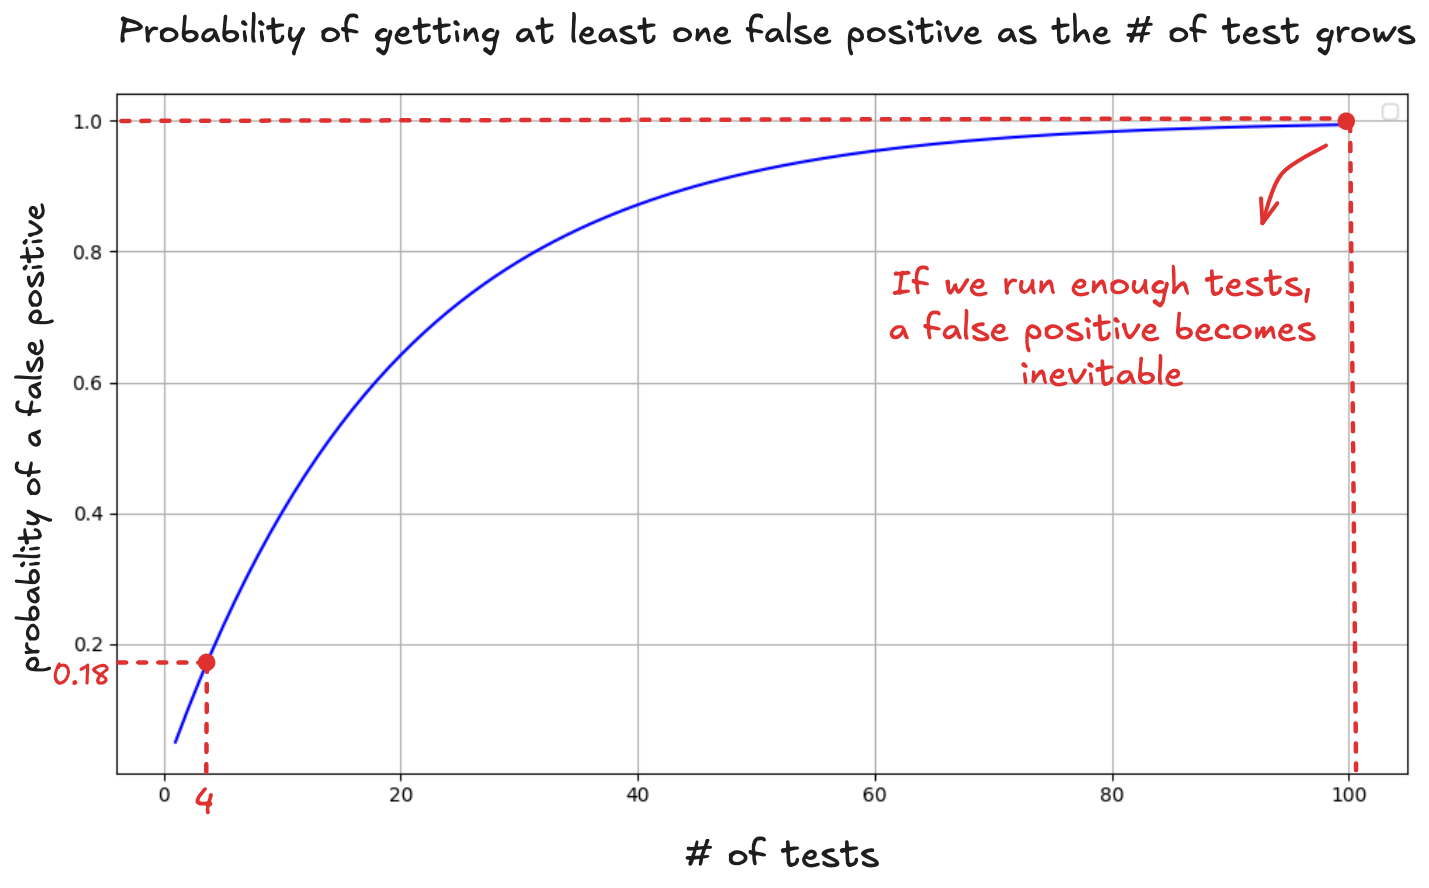
Bottom line: you ran a four-arm experiment but interpreted it like a one-arm test. You never adjusted your cutoff to account for multiple comparisons. Which means the p-value you relied on doesn’t mean what you think it does.
This is p-hacking. You looked at the results, picked the one that cleared the bar, and ignored the fact that the bar was never calibrated for this setup.
How to avoid this: adjusting the threshold
The Bonferroni Correction is one way to avoid using the wrong cutoff when testing for multiple options. It's straightforward: you account for the number of hypotheses k by adjusting the acceptable p-value for significance:
In our dashboard test with 4 variants, that’s:
Under this correction, only p-values below 0.0125 should be considered significant. Your p = 0.041 result? It no longer qualifies.
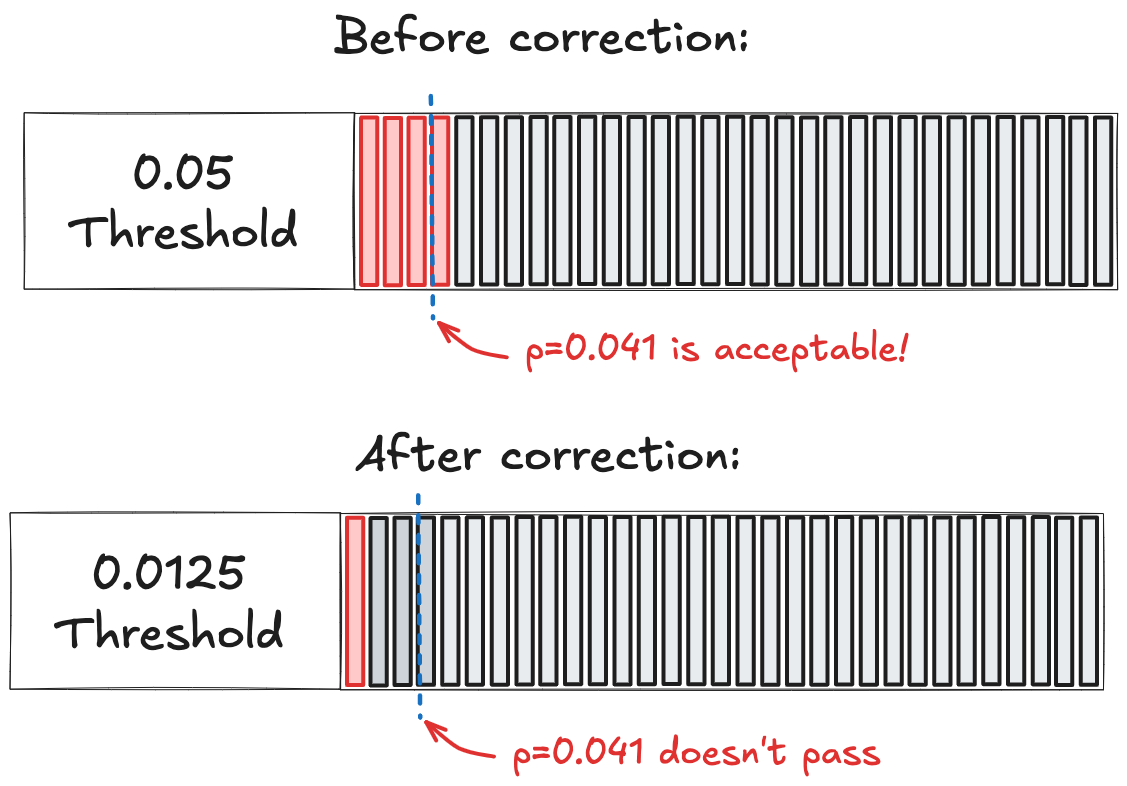
Fewer results will pass the bar. That can feel frustrating in fast-moving product teams. But now you're actually measuring something you can trust.
Example 02: Reframing the metric after the results are in
Back to the dashboard experiment: after you applied the Bonferroni correction you got... nothing. None of your dashboard variants significantly improved user signup rates.
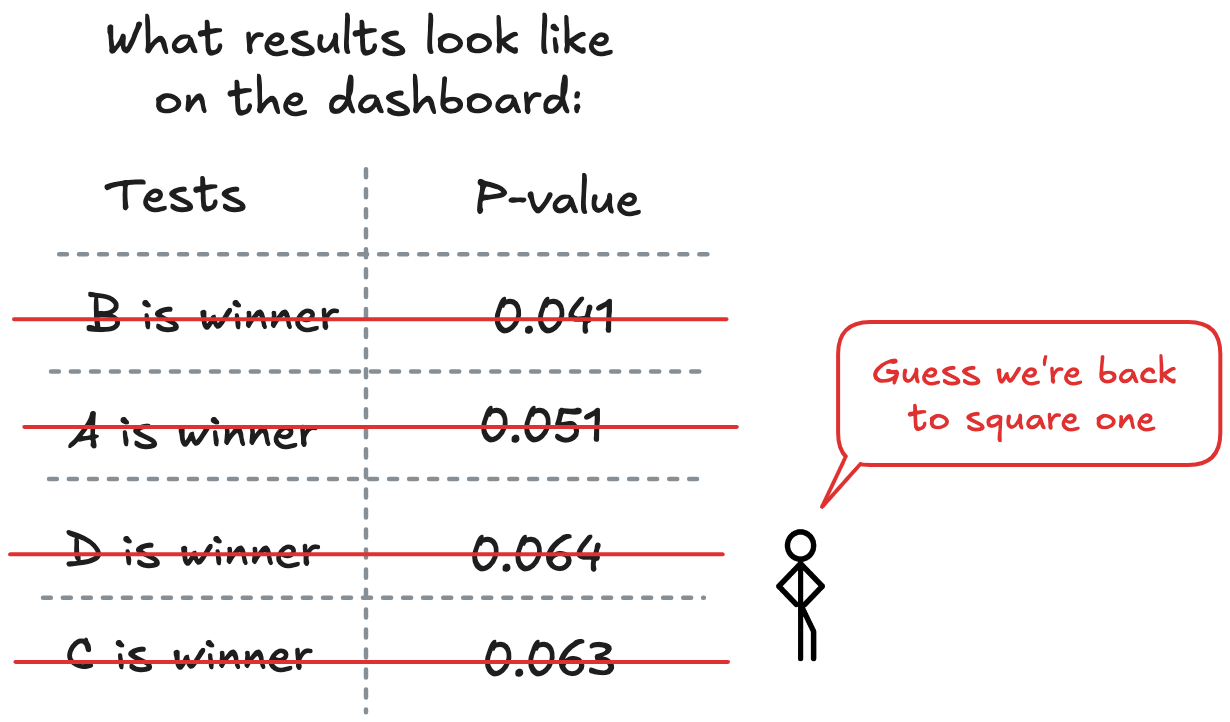
This is frustrating. You've invested weeks in the redesign, and you're facing a product review with no wins to show. Nobody likes arriving empty-handed to leadership meetings.
So you dig deeper. The data's already collected so why not explore other insights? Maybe signups didn't improve, but what about retention? You check for retention rates and discover something interesting:
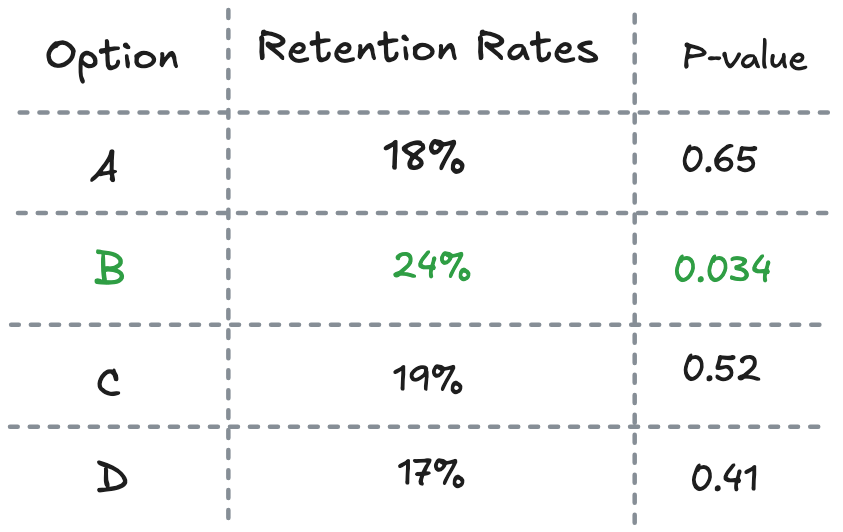
Option B shows slightly higher retention than the rest, with p = 0.034. Suddenly your narrative shifts: "This experiment was really about improving retention all along!"
You pivot the story and now it’s tempting to call it a win for B and ship it. But each extra metric you check is another chance for randomness to sneak in. If you check 20 metrics, the odds that at least one will look like a winner by pure chance shoot up to about two in three. That’s because the probability that none of the 20 metrics show a false positive is:
Graphically, it looks like this:

That promising retention improvement? It’s just the kind of anomaly you’d expect to find after enough digging.
The pre-registration solution
Each time you add a new metric, you increase the chance of finding a false positive. A single test with a threshold of p < 0.05 implies a 5 percent risk of error. But the more tests you run, the more that risk accumulates. In the limit, it approaches certainty.
Pre-registration prevents this. By stating in advance which metric will count as evidence, you fix the false positive rate at its intended level. The p-value retains its meaning. You are testing one hypothesis, not several in disguise.
Decide your success metrics before running the test. Document them explicitly and stick to them.
This isn't academic nit-picking. It's how medical research works when lives are on the line. Your startup's growth deserves the same rigor.
Example 03: Running experiments until we get a hit
Even if you’ve accounted for multiple variants and didn't the temptation to shift metrics, one bias remains: impatience. The lure of early results is difficult to ignore and can lead to bad decisions
Now you're running an A/B test of two button styles, scheduled for two weeks.
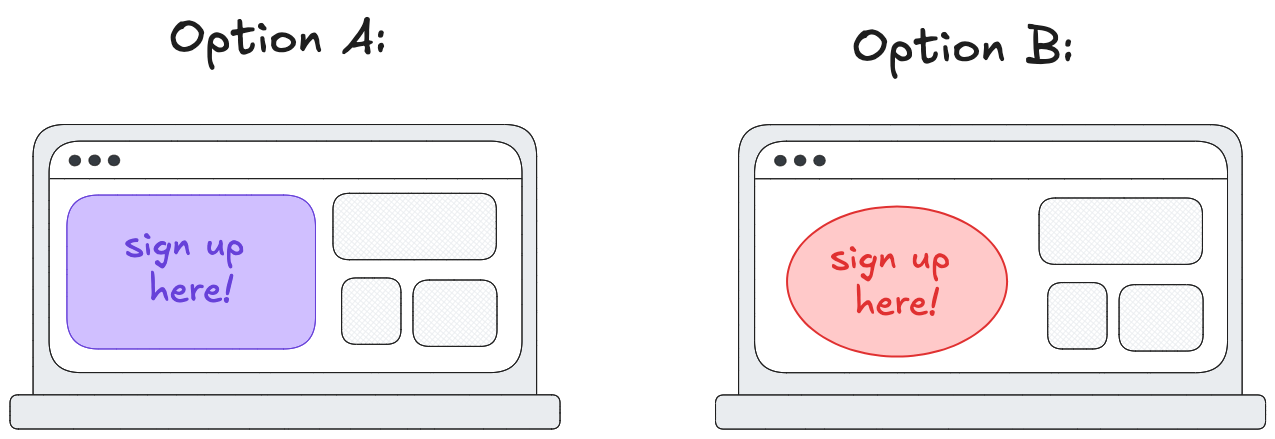
Each day, you check the dashboard, just in case. On the ninth day, the p-value for button B dips to 0.048:
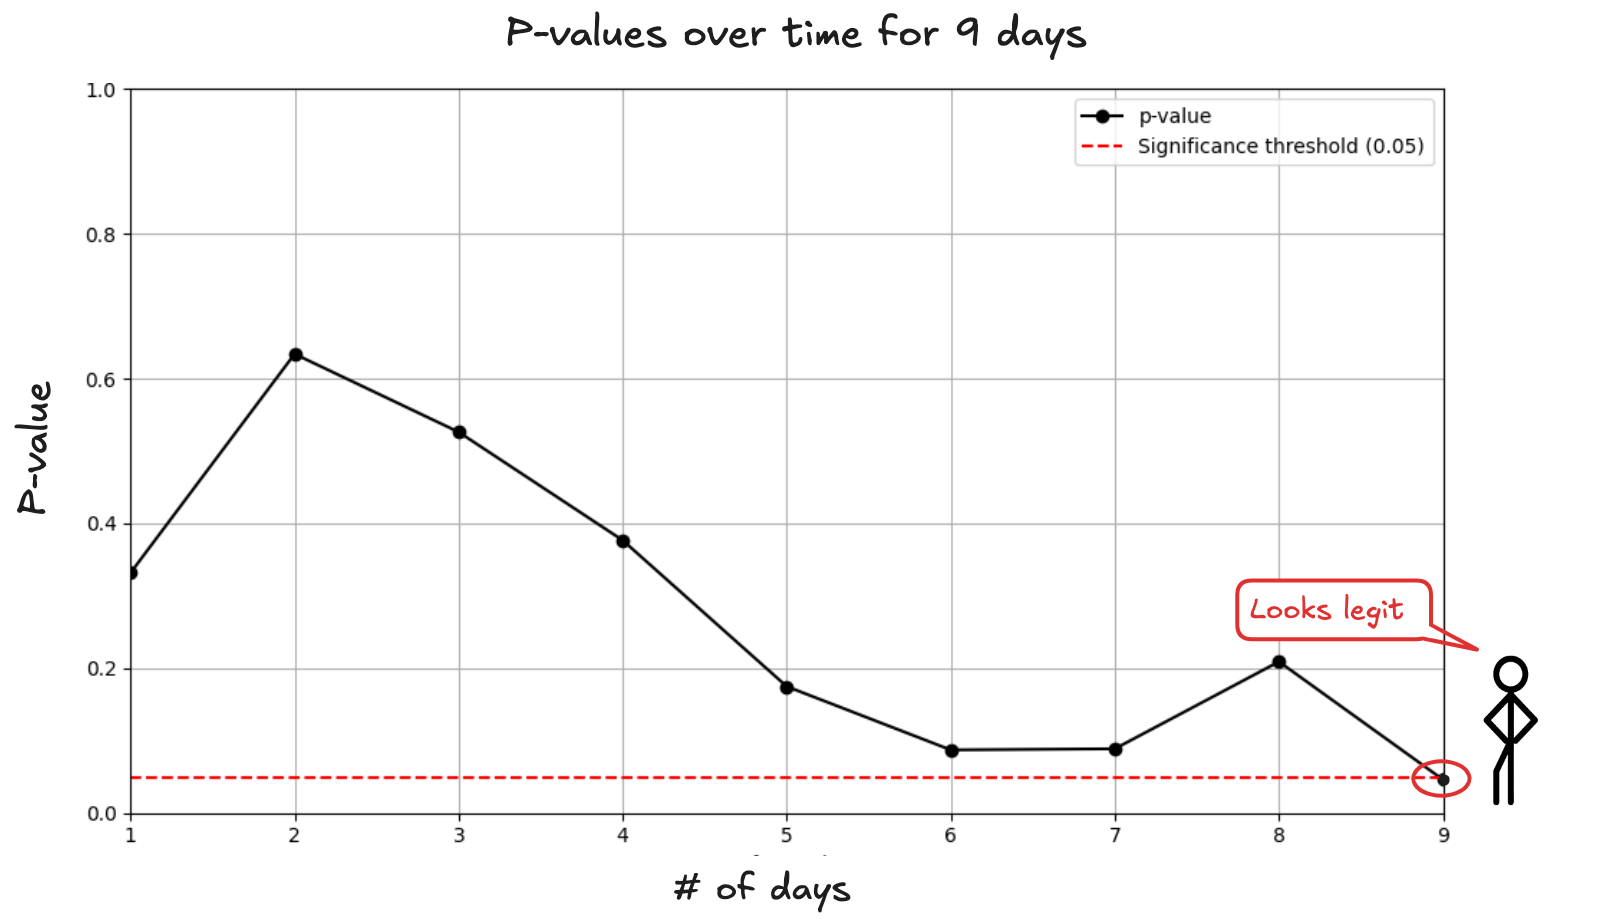
Should you stop the test and ship B? At this point, you know a win shouldn’t come that easily. A p-value only works if you set your stopping rule in advance. Peeking the p-value each day during nine days is like you’re running nine experiments. Each day is a new opportunity for randomness to look like signal.
After 9 peeks, the probability that at least one p-value dips below 0.05 is:
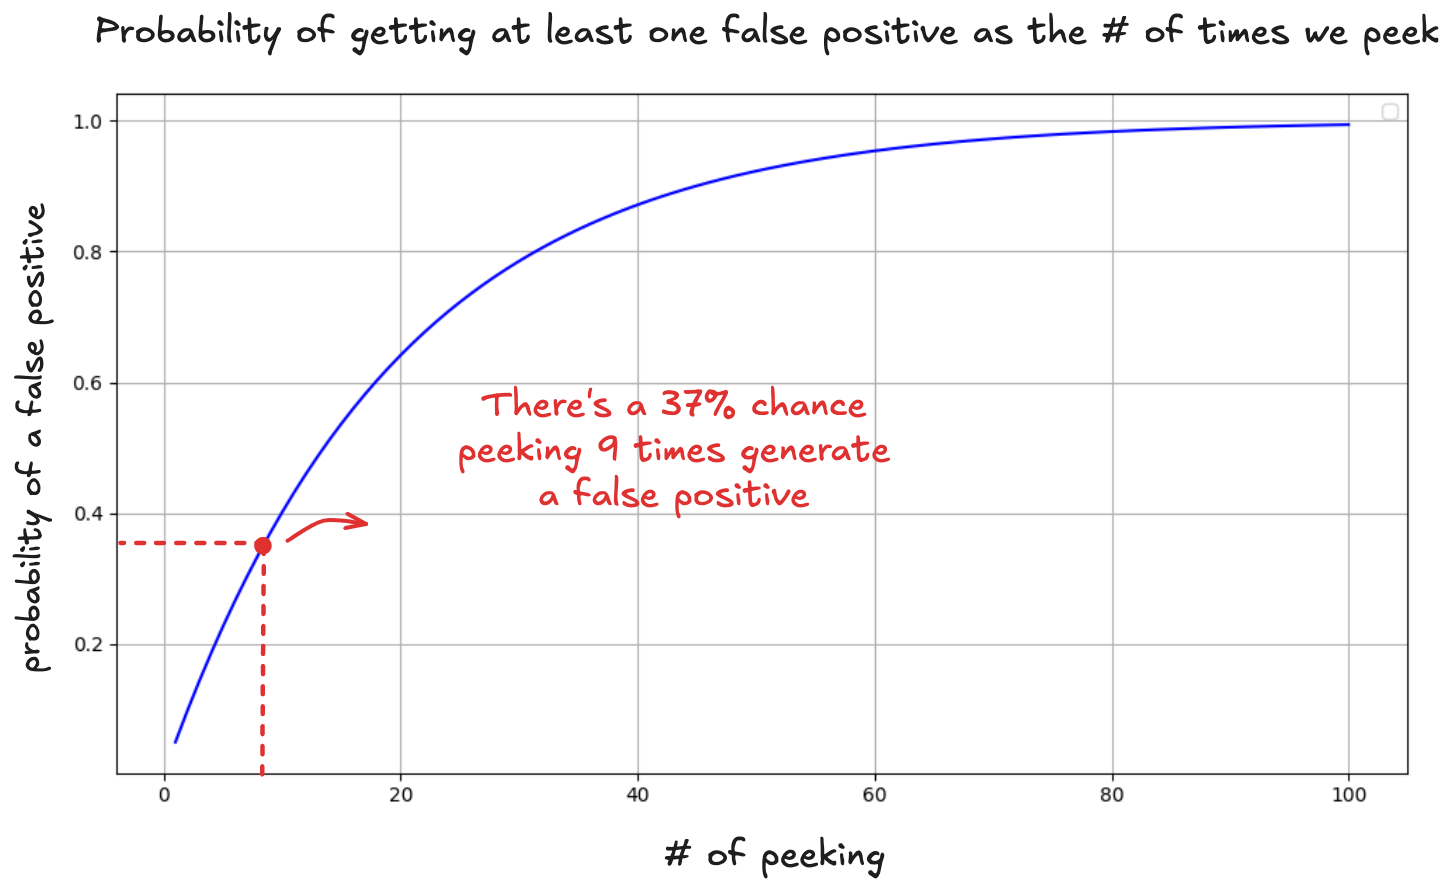
And there’s another subtle trap: by not waiting for the experiment to finish, you’re watching the p-value bounce around as new data arrives. That "significant" result on day 9 might be nothing more than a lucky swing, gone by day 14:
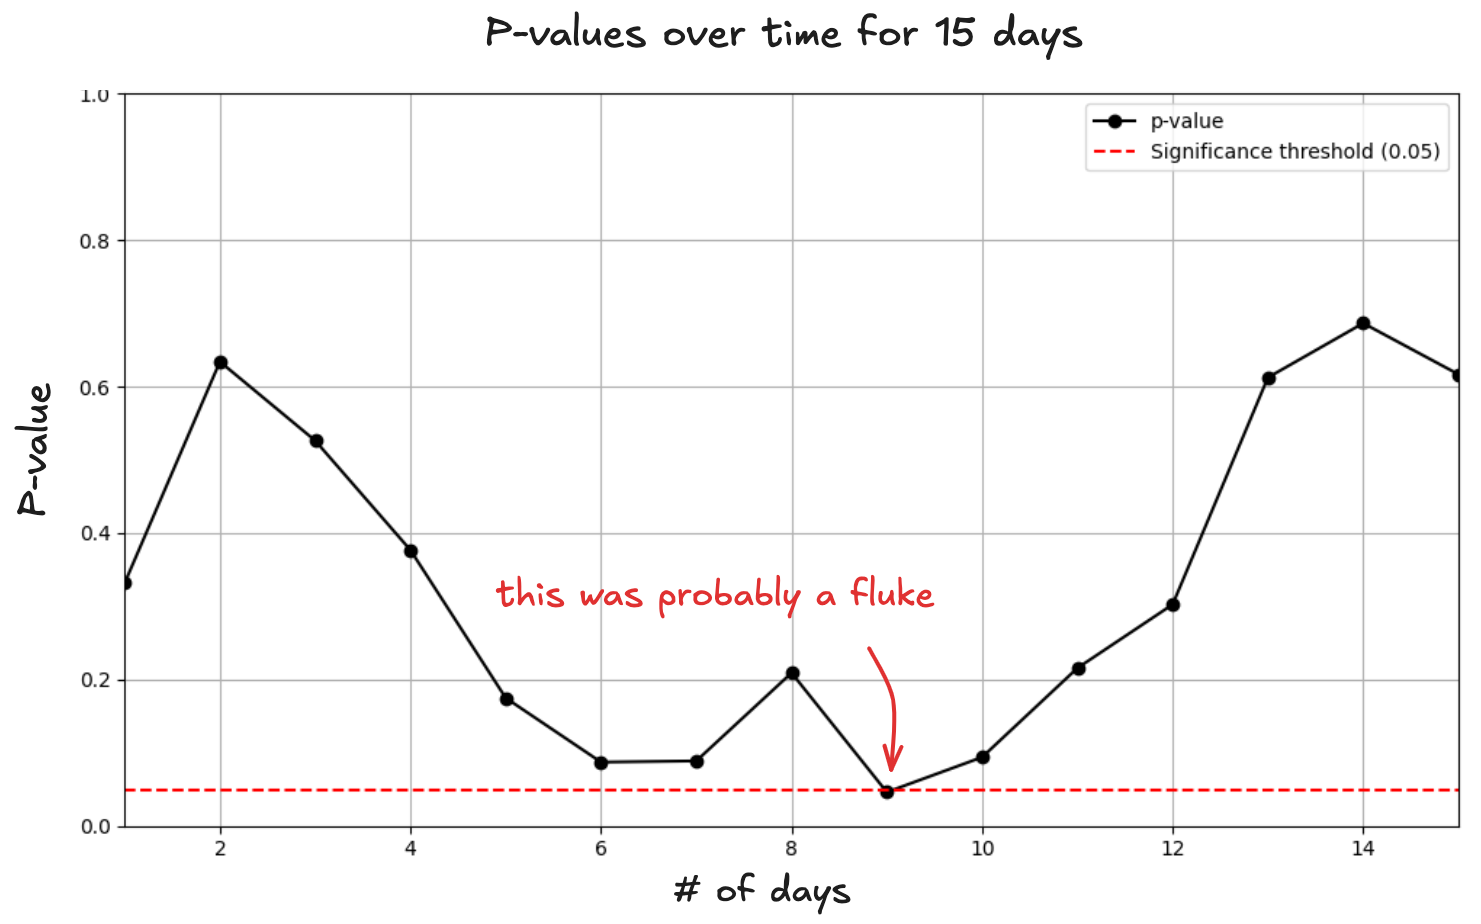
Shipping on an early p-value is like betting on a horse halfway around the track.
How to properly peek
If you absolutely must make early stopping decisions, here’s how to do it responsibly using sequential testing.
Let’s go back to our button test. You planned to collect data for 2 weeks. Instead of using a flat the whole time, sequential testing adjusts the threshold depending on when you stop:
- Week 1: Only stop if p < 0.01 (super strict)
- Day 10: Only stop if p < 0.025 (still strict)
- Day 14: Normal p < 0.05 threshold
This approach controls the overall false positive rate, even if you peek multiple times.
Remember our day 9 result where p = 0.048? Under sequential testing, that wouldn't qualify. You'd need p < 0.01 to stop in week 1. So you'd keep running the test and probably discover it wasn't actually significant:

It works like "spending" your false positive budget gradually instead of all at once.
So yes, you can peek with discipline. But for most teams, the simpler and safer move is still the right one: wait the damn two weeks.
In summary
Your next experiment will be more reliable if you:
- Pre-register hypotheses and metrics
- Avoid digging through metrics post hoc
- Use corrections when testing multiple variants
- Apply proper thresholds if you peek early
- Celebrate definitive negative results (might be controversial)
The irony is that better statistical practices actually accelerate learning. Instead of shipping noise and wondering why your metrics plateau, you'll build genuine understanding of what drives user behavior. That's worth slowing down for.
