
Data analysis is the art of finding patterns that aren’t obvious. Some of those patterns come in numbers: frequencies, correlations, predictions. Others come in words: complaints, themes, tone. Historically, we’ve treated these as separate problems: quantitative and qualitative analysis. Each problem has its own methods and tools. But AI doesn’t make that distinction. It treats both as data. This article shows how to use AI to extract insight from both kinds of data using techniques tailored to each, and combining them where it matters. The goal isn’t just automation. It’s better reasoning.
Definitions and Research Paradigms
Before diving into techniques, it's important to clarify what we mean by quantitative and qualitative analysis in the context of AI.
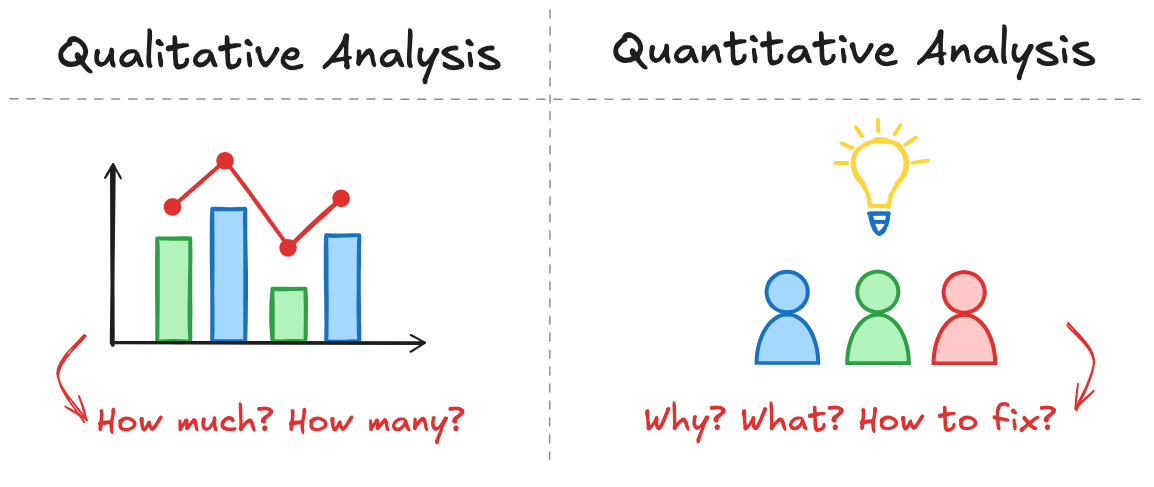
Quantitative analysis deals with structured, numerical data: things like conversion rates, usage counts, or revenue over time. It answers questions like how much or how often. Qualitative analysis focuses on unstructured or semi-structured inputs such as customer feedback, support tickets, or survey comments. It asks why something is happening.
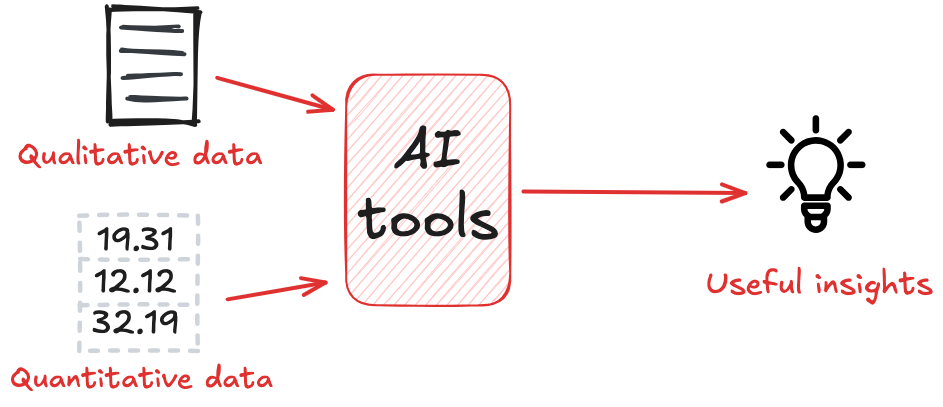
The right AI tools enable analysis across both numerical and textual data. It can process metrics like usage rates and error counts alongside unstructured inputs like support messages or survey responses. By extracting patterns and relationships from each, AI helps generate interpretable signals about what’s happening and why. It turns both quantitative and qualitative data into structured, actionable insight.
If you're interested in how these insights can also be translated into visuals, see our related post: Generative AI for Data Visualization: See What You’ve Been Missing.
When to Use Each Approach
Deciding whether to use a quantitative, qualitative, or mixed-methods approach isn't just a technical choice; it depends on the nature of the question, the structure of the data, and the level of interpretation required.
Start with the nature of the question. If you're trying to measure behavior, like how many users clicked a button, you’re in quantitative territory. These are questions about patterns, counts, and changes over time. If instead you’re asking why something is happening (like what’s frustrating users), you're asking a qualitative question. And if you're trying to connect the two, such as explaining a usage drop by analyzing support messages, you're looking at a mixed-methods problem.
Then, consider the structure of the data. Numerical logs, timestamps, and categorical fields naturally feed into quantitative analysis. Open-ended survey responses, transcripts, reviews, and chats are messy, subjective, and language-based: perfect candidates for qualitative analysis. When you have both, like usage data paired with written feedback,
Finally, think about your interpretability needs. If you need metrics for dashboards or forecasts, go quantitative. If you need to understand sentiment, user intent, or friction points in a product experience, qualitative methods are more appropriate. If you need to generate hypotheses, debug unexpected results, or contextualize anomalies, a mixed approach will give you a fuller picture.
In practice, the strongest analyses move across modes. AI enables that flexibility by treating numbers and language as inputs to the same reasoning process.
AI Techniques for Quantitative Data
Quantitative analysis has long relied on statistical tools to model relationships, detect trends, and make predictions. What AI adds isn’t a replacement for these tools, but a system for deploying them more intelligently: at scale, under uncertainty, and with less manual friction.
Rather than scripting each transformation or tuning each parameter, you describe what you want to understand. The AI takes over from there by profiling distributions, engineering features, comparing models, and surfacing explanations. It acts less like a calculator, more like an assistant that knows which questions to ask next. This is especially powerful in two foundational areas: predictive modeling and time-series forecasting, where AI systems streamline not just what you model, but how you interpret the results.
Statistical Modelling, Time-Series Forecasting
AI doesn’t reinvent statistical modeling—it extends and accelerates it. In traditional workflows, analysts choose a model, tune its parameters, and validate its performance manually. This process is slow, and it demands a high level of statistical fluency. AI systems automate much of that: they can evaluate dozens of candidate models—linear, tree-based, ensemble—optimize hyperparameters, and benchmark their performance across cross-validation folds. The result isn’t just a fitted model, but a vetted one, built and ranked with speed and consistency. This frees analysts to focus on what matters: interpreting the output and deciding what to do with it.
The same is true in time-series forecasting, where AI moves beyond the limits of classical models. Tools like ARIMA and exponential smoothing are still valuable, but they assume stability and linearity, which many real-world systems lack. Forecasting with AI means working with deep models like LSTMs and temporal attention networks that can track seasonality, lag dependencies, structural breaks, and irregular input rhythms. These models don’t just project a single outcome; they simulate plausible futures under changing conditions, providing a broader view of what might happen—not just what’s likely.
Equally important, AI explains its forecasts. It shows which variables contributed most to a prediction, how those relationships change over time, and where the model’s confidence drops. With tools like SHAP values, attention maps, and uncertainty bands, even complex models become interpretable. AI keeps quantitative analysis grounded in evidence and accessible to human judgment. It speeds up the modeling process without turning it into a black box.
AI Techniques for Qualitative Data
Qualitative data poses a different challenge. It doesn’t come pre-structured or easily counted. It arrives in the form of sentences, paragraphs, transcripts, reviews—ambiguous, context-rich, and often noisy. For a long time, analyzing this kind of data meant manually reading and coding it, trying to tease out common patterns by hand.
Artificial intelligence changes that. With large language models and natural language processing (NLP), machines are able to extract structure from unstructured text. They can identify themes, emotional tone, and semantic similarity with far greater speed and coverage than manual review. In doing so, AI turns qualitative data into something you can analyze with the same rigor as numbers.
NLP Topic Modelling, Sentiment Analysis, Thematic Coding
AI helps analysts reason with language in three main ways.
At the heart of qualitative AI is topic modeling: algorithms that detect recurring themes in large volumes of text. Classical methods like Latent Dirichlet Allocation (LDA) group words into topics based on co-occurrence. Newer models like BERTopic and GPT-derived embeddings cluster documents semantically, capturing nuance and phrasing that simple frequency counts miss.
Alongside topics, AI can also infer sentiment—the emotional tone behind text. Whether it's frustration in a product review or satisfaction in a support chat, AI models classify polarity (positive, neutral, negative) and often score it on a continuous scale. This turns subjective language into a measurable signal, usable in statistical models or time-trend analysis.
More structured still is thematic coding: the process of assigning meaning-based labels to passages of text. Traditionally done by human coders, it’s now supported by supervised classifiers, fine-tuned LLMs, and zero-shot prompt pipelines. You can give the model examples—“comments about usability,” “pricing complaints,” “praise for support”—and it will label new data accordingly.
These tools don’t eliminate interpretation; they accelerate it. Instead of reading every comment, the analyst reads the map the AI creates: the clusters, the themes, the emotional patterns. And just like in quantitative work, the real value lies not in the automation, but in what it frees you to ask next.
Tool Landscape and Selection Criteria
The AI tool landscape for data analysis is broad and uneven. Some platforms are designed for analysts who want control and visibility over every step of the pipeline. Others abstract that complexity away, aiming for accessibility, speed, or end-to-end automation. Knowing which tool to choose depends less on benchmarks than on how you reason with data: exploratory or confirmatory, statistical or semantic, manual or augmented.
Tools like scikit-learn, statsmodels, and Prophet remain foundational for statistical modeling and forecasting. They offer fine-grained control but require explicit configuration and domain fluency. For faster iteration, AutoML platforms such as H2O.ai, DataRobot, and PyCaret handle preprocessing, model selection, and tuning—useful for rapid testing and production pipelines. If you want to know more about the ideal tools for this, check the Best AI tools for Data Analysis guide on Briefer's blog.
Briefer stands out by supporting both structured and unstructured data in a single workflow. Rather than treating quantitative and qualitative analysis as separate tracks, it allows users to move fluidly between them. You can query tabular data in natural language, extract themes from text, visualize clusters, and surface statistical patterns: all within the same interface. Its AI agent handles summarization, feature extraction, and anomaly detection across formats, helping analysts reason through complexity without switching tools or losing context. We talk more about leveraging Briefer's AI on AI for Data Analysis blog.
Ethical Considerations, Bias and Context Loss
AI models are only as reliable as the data they’re trained on—and the assumptions baked into them. When applied to both quantitative and qualitative analysis, those limitations can compound in subtle ways. On the quantitative side, AI can reinforce measurement bias: it tends to favor what’s easy to count, sidelining what’s harder to quantify. On the qualitative side, models trained to summarize or classify text may flatten nuance, blur disagreement, or generate structure where none exists.
This is especially true in tasks like sentiment analysis or topic modeling. A sentiment score might label a comment as "negative" without distinguishing frustration from sarcasm; or critique from irony. Topic models might lump together a bug report and a feature request, obscuring intent. The result is misleading: when language is reduced to metrics, context can disappear.
That’s why interpretability matters. Good tooling makes AI decisions traceable, letting analysts see what the model outputs and understand why. This is critical in mixed-methods workflows, where insights come from blending statistical signals with human language. The ethical burden isn’t just on the model; it’s on how we, as analysts, question its outputs, inspect its reasoning, and stay alert to what might be missing.
Further Learning
AI can be used to give structure to language and meaning to numbers, allowing analysts to move across methods with speed and precision. From forecasting metrics to extracting themes, from debugging models to summarizing feedback, AI enables a fuller, more flexible way to reason with data.
If this article outlined the possibilities, our Learn AI for Data Analysis guide is where to go next. It’s built to help you get started and develop your skills.