People usually ask me what's wrong with Jupyter Notebooks and why we're building a tool to replace them. They also ask us how we're making notebooks better.
I usually repeat the same things over and over, so I thought I'd write them down here so I can link to it.
1. Too messy too quickly
The first thing I don't like about notebooks is that they get too messy too quickly. One morning you have 10 blocks, and by the end of the day you have 192, but only six of them are meant to be seen by other people and the rest is just you jiu-jitsuing with the data.
We solved that problem by doing three things.
First, we allowed people to group their blocks into tabs. This way, you can have an "API Call" tab to fetch data, a "Data Cleaning" tab to clean it, and a "Visualization" tab to plot it.
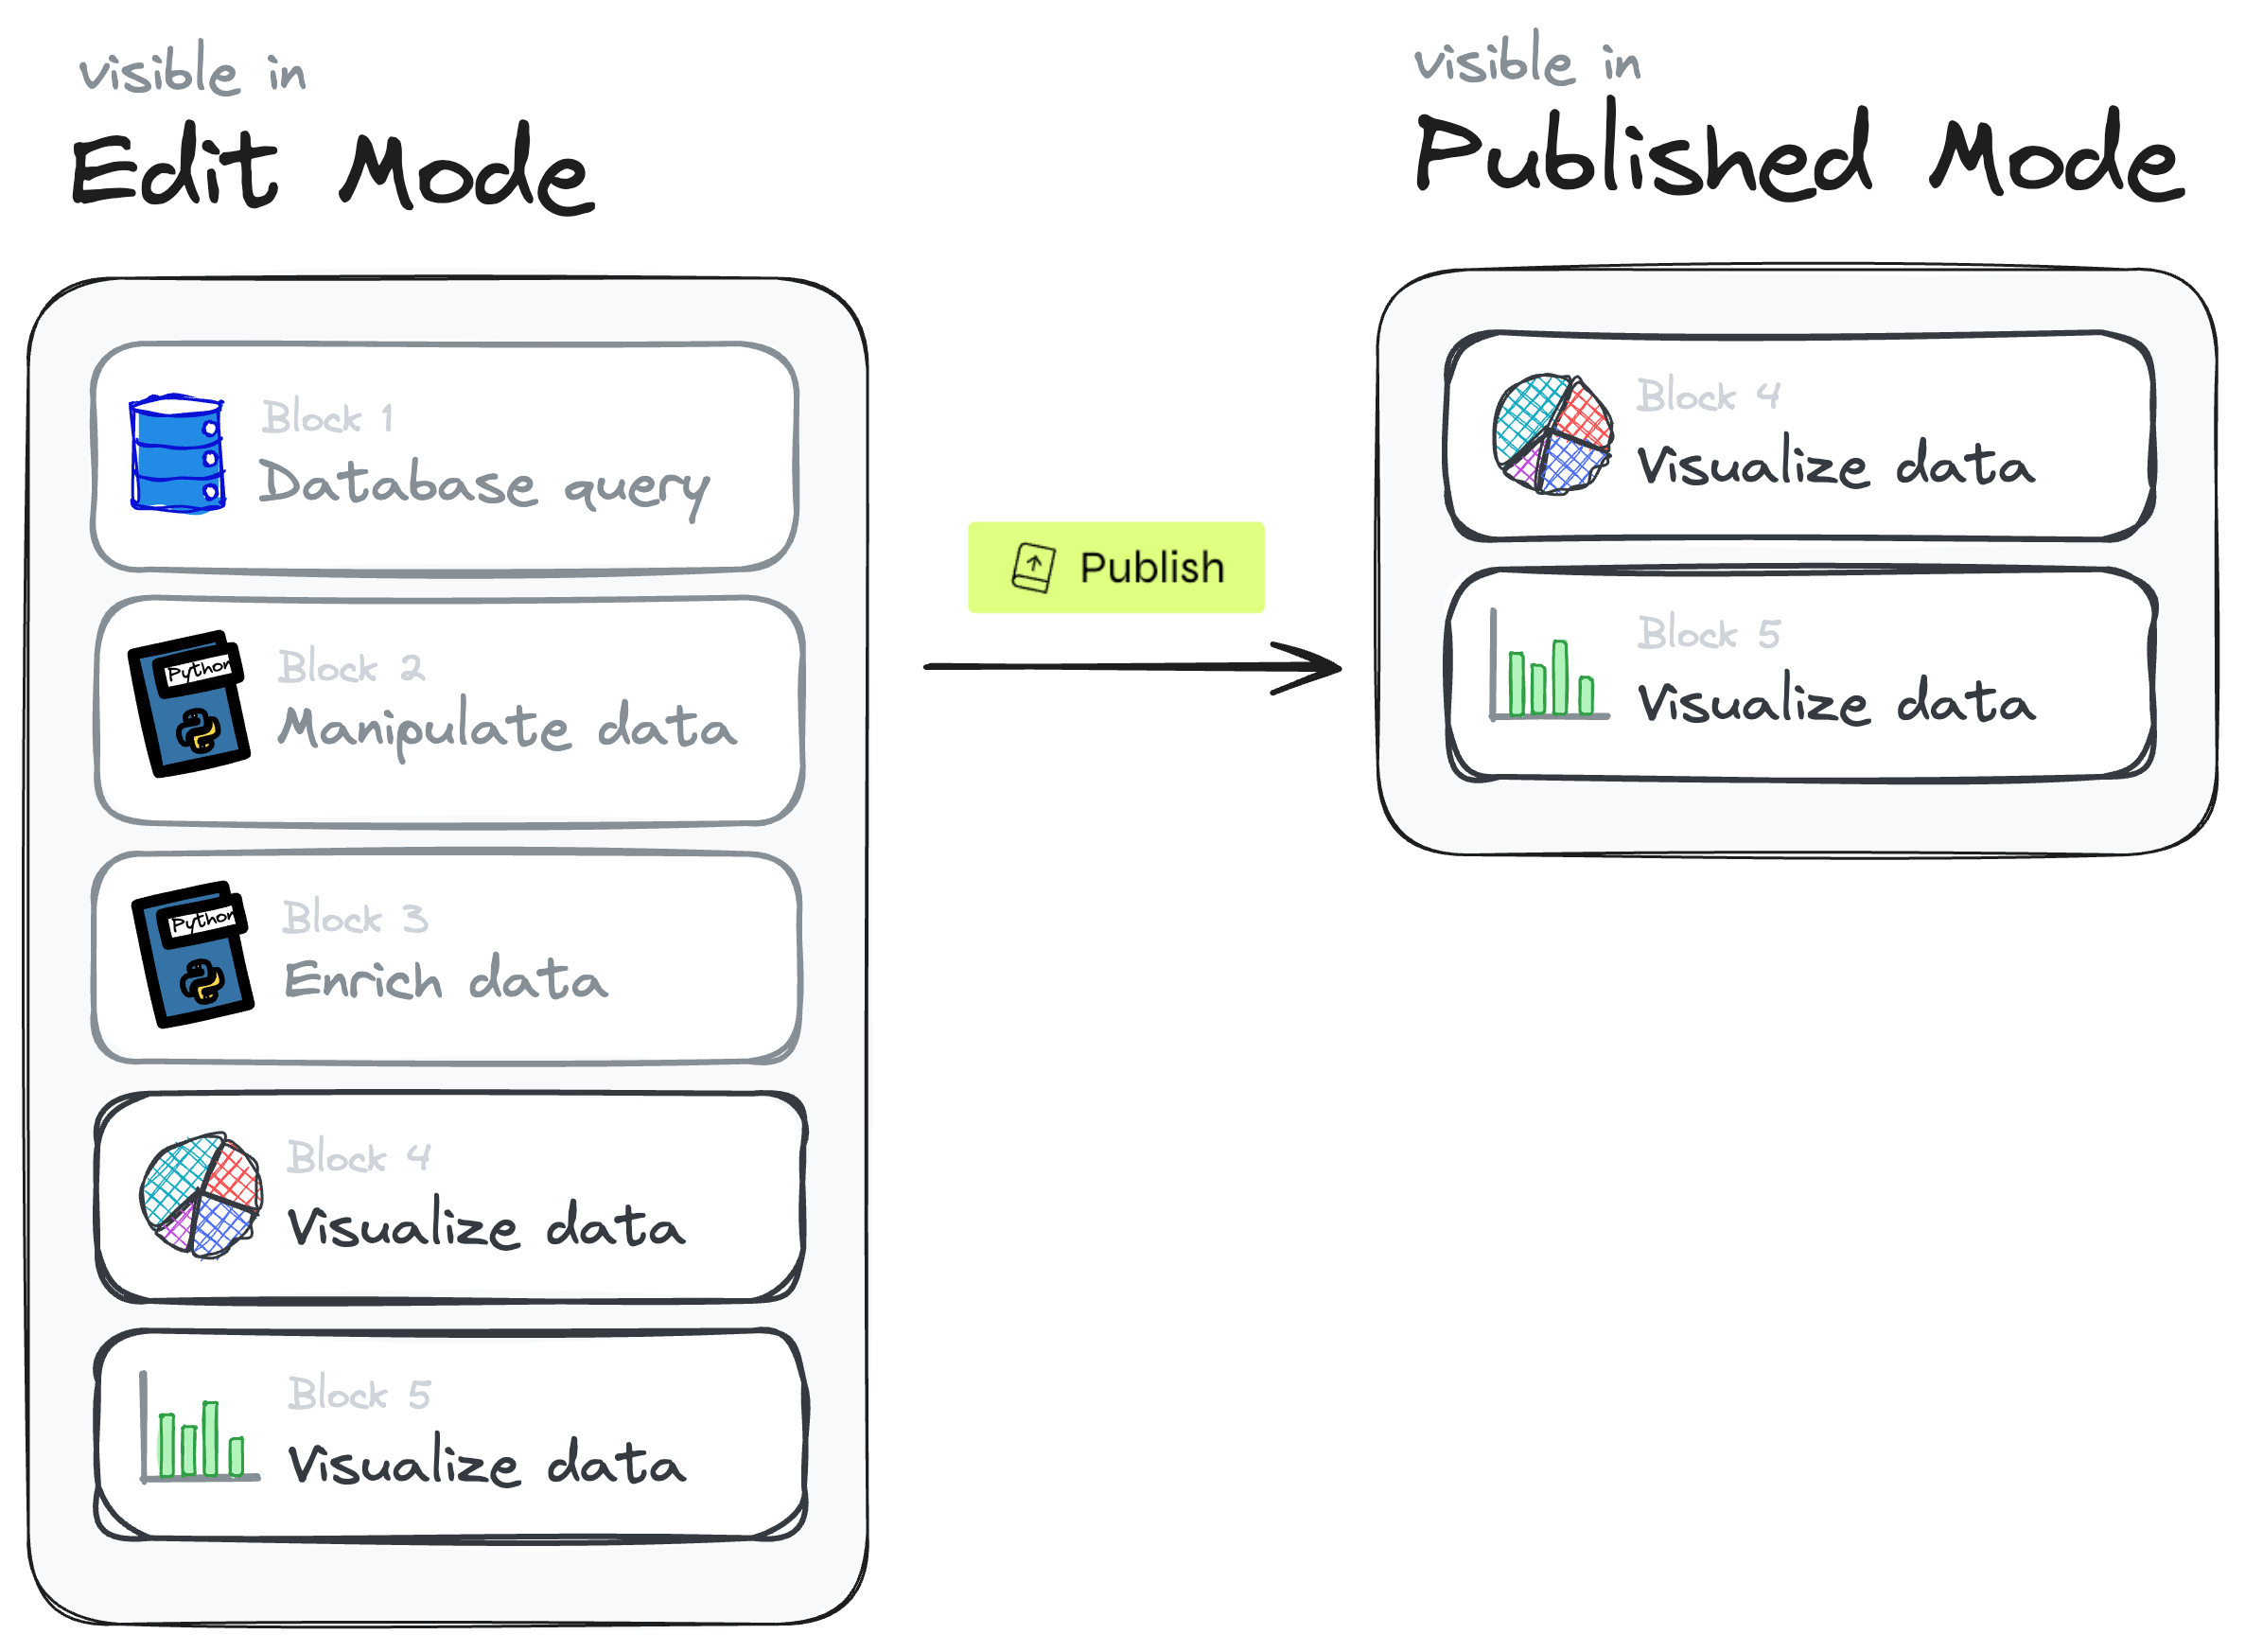
Then, we created the concept of "publishing" a notebook and added buttons for people to hide certain blocks from the published version.
Finally, we realized that vertical scrolling is not always the best way to navigate a notebook. It wastes a lot of screen real estate and makes it hard to see the "big picture" of what's going on.
We fixed that by adding a "dashboard" view with a grid in which you can drag and drop blocks.
Today, most published notebooks use the dashboard view instead of the traditional vertical scrolling.
2. Difficult to find and explore
The second thing I don't like about notebooks is that they go to GitHub and then die because no one ever opens them again.
I wanted notebooks to be "live" artifacts that everyone can find, open, and explore, including non-technical people.
To solve that problem we created a Notion-like file tree.
The file tree makes notebooks more approachable because it allows you to create top-level notebooks like "Sales Team" and put all your sales-related notebooks inside it, like sales forecasts and customer segmentation.
I know the icon selection is a bit cheesy, but it makes things more approachable for non-technical people. Once we launched this feature, people complained that it included 288 icons "only" and that they wanted more, so we added an extra 1487. Today, most notebooks have a custom icon.
3. Too much friction for querying databases
The third thing I don't like about notebooks is that they require a lot of boilerplate code to query databases.
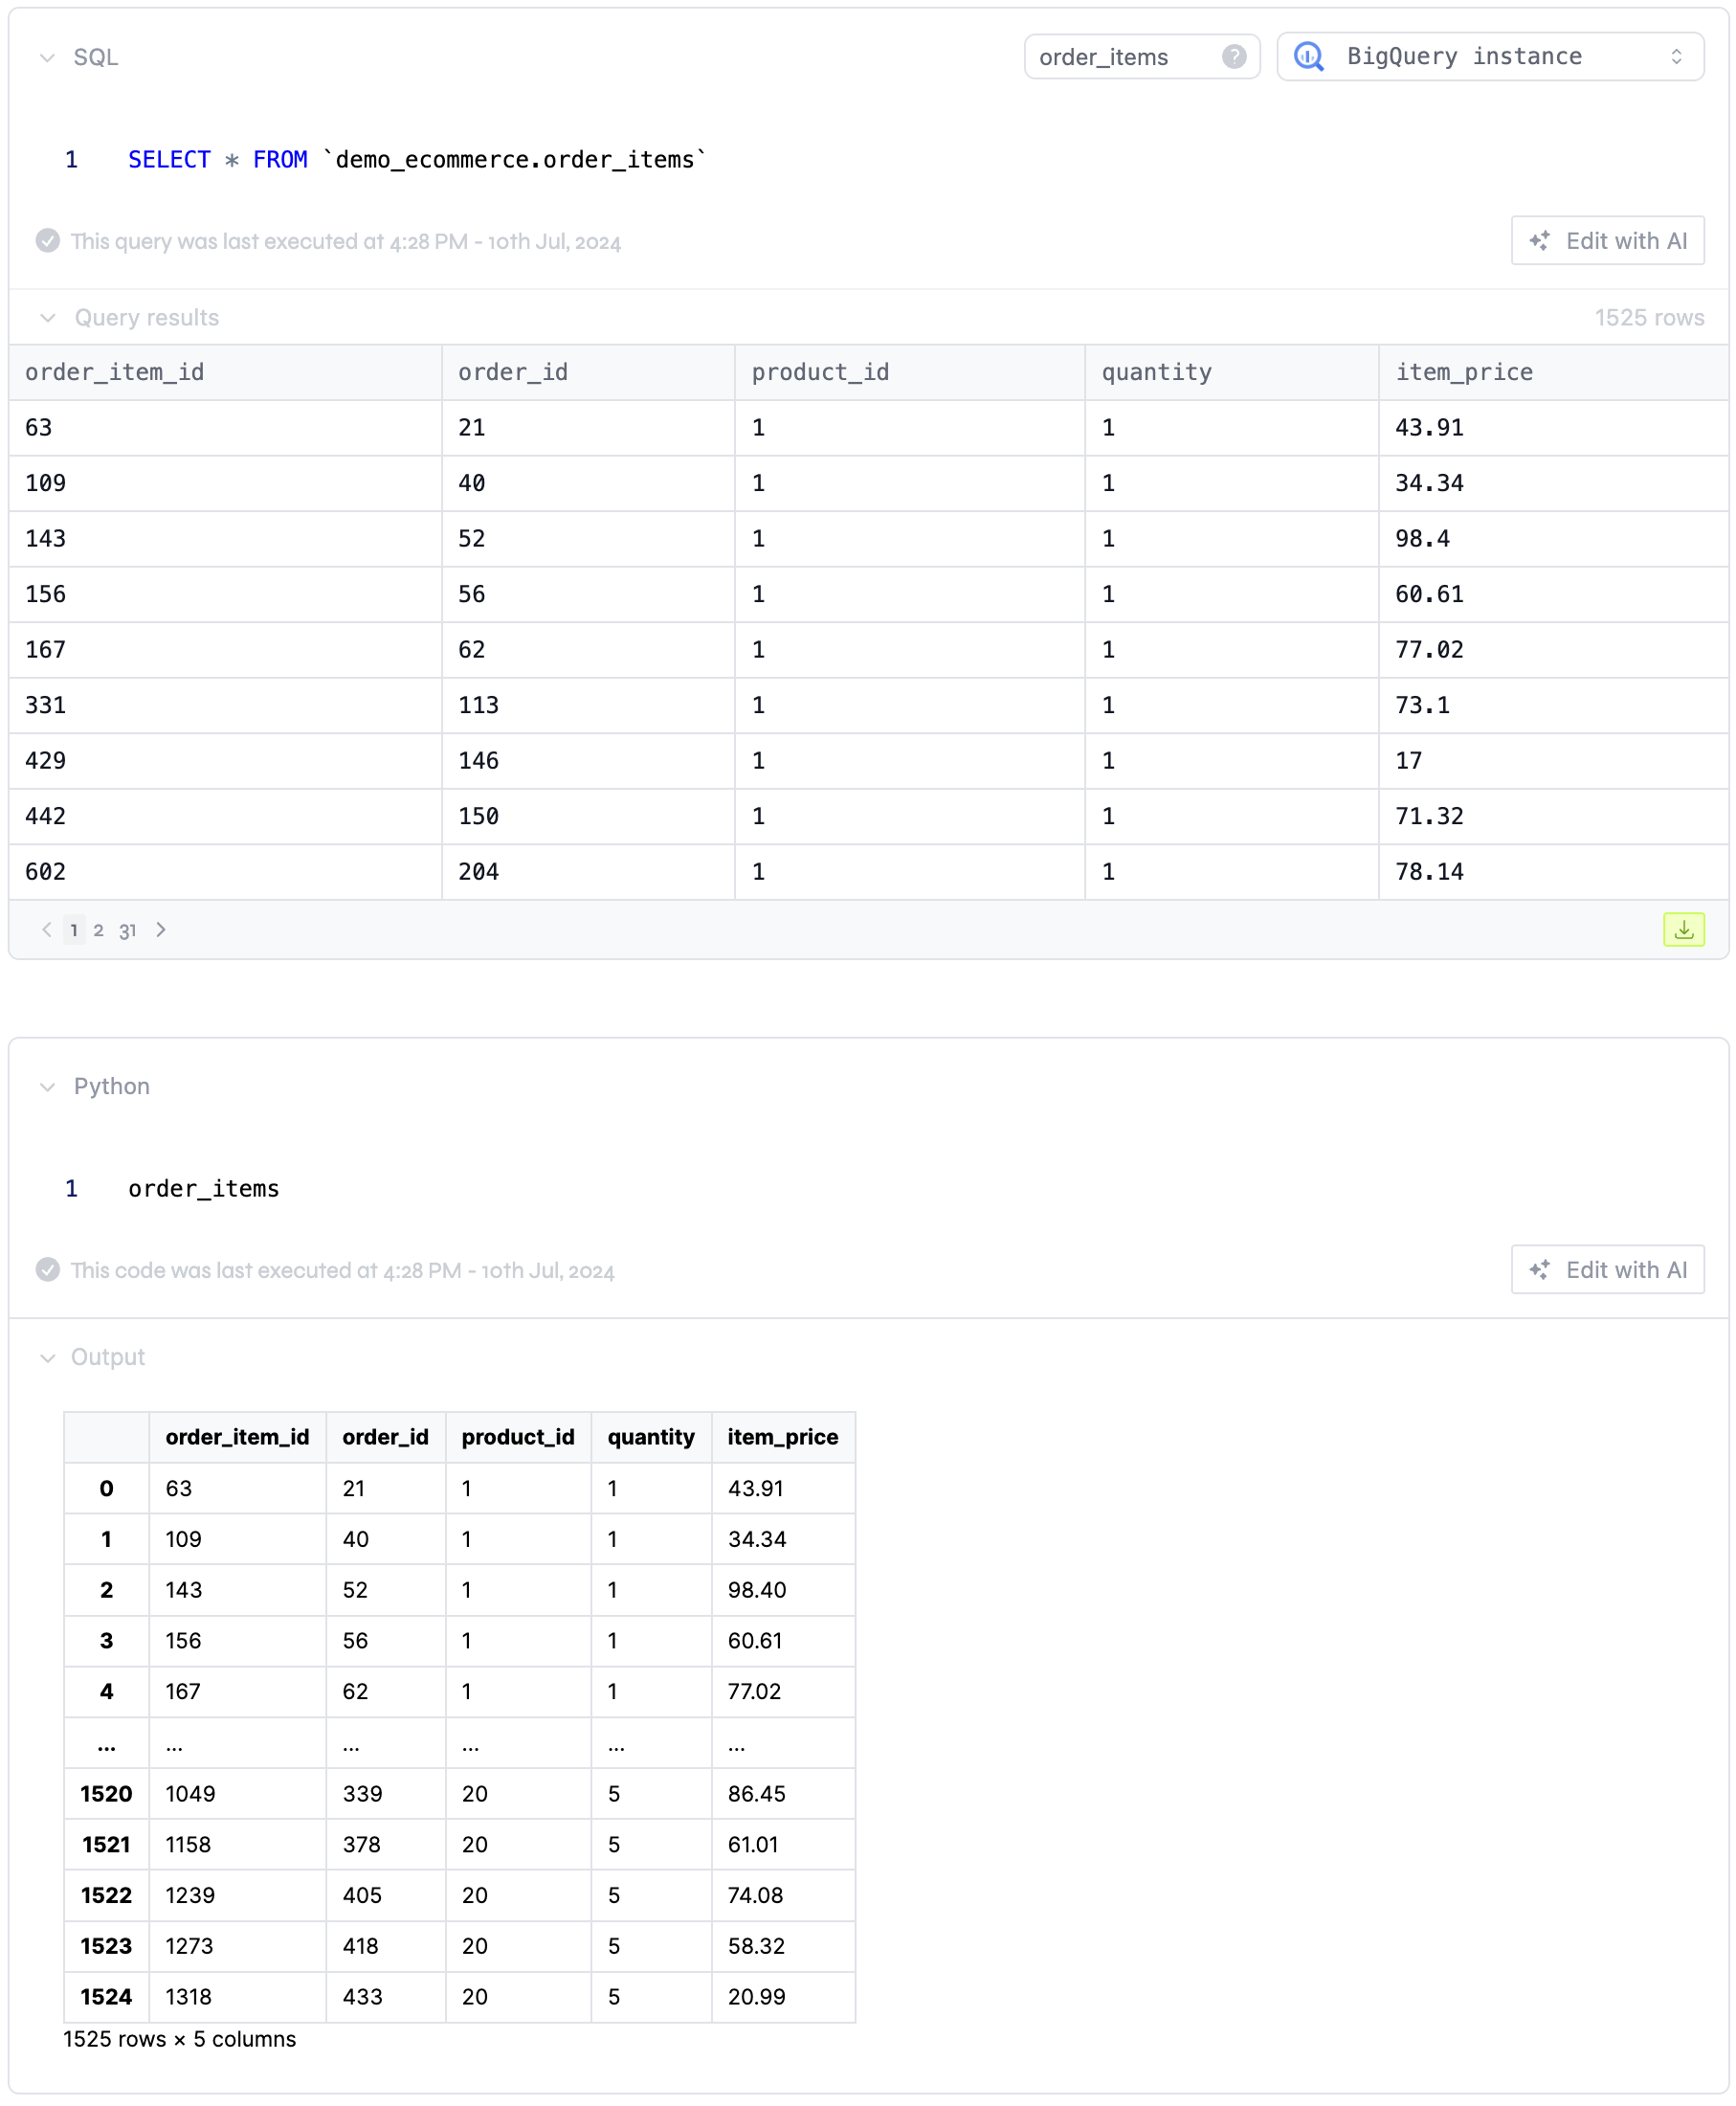
We fixed that by adding a "query" block that allows you to write SQL and see the results in a table.
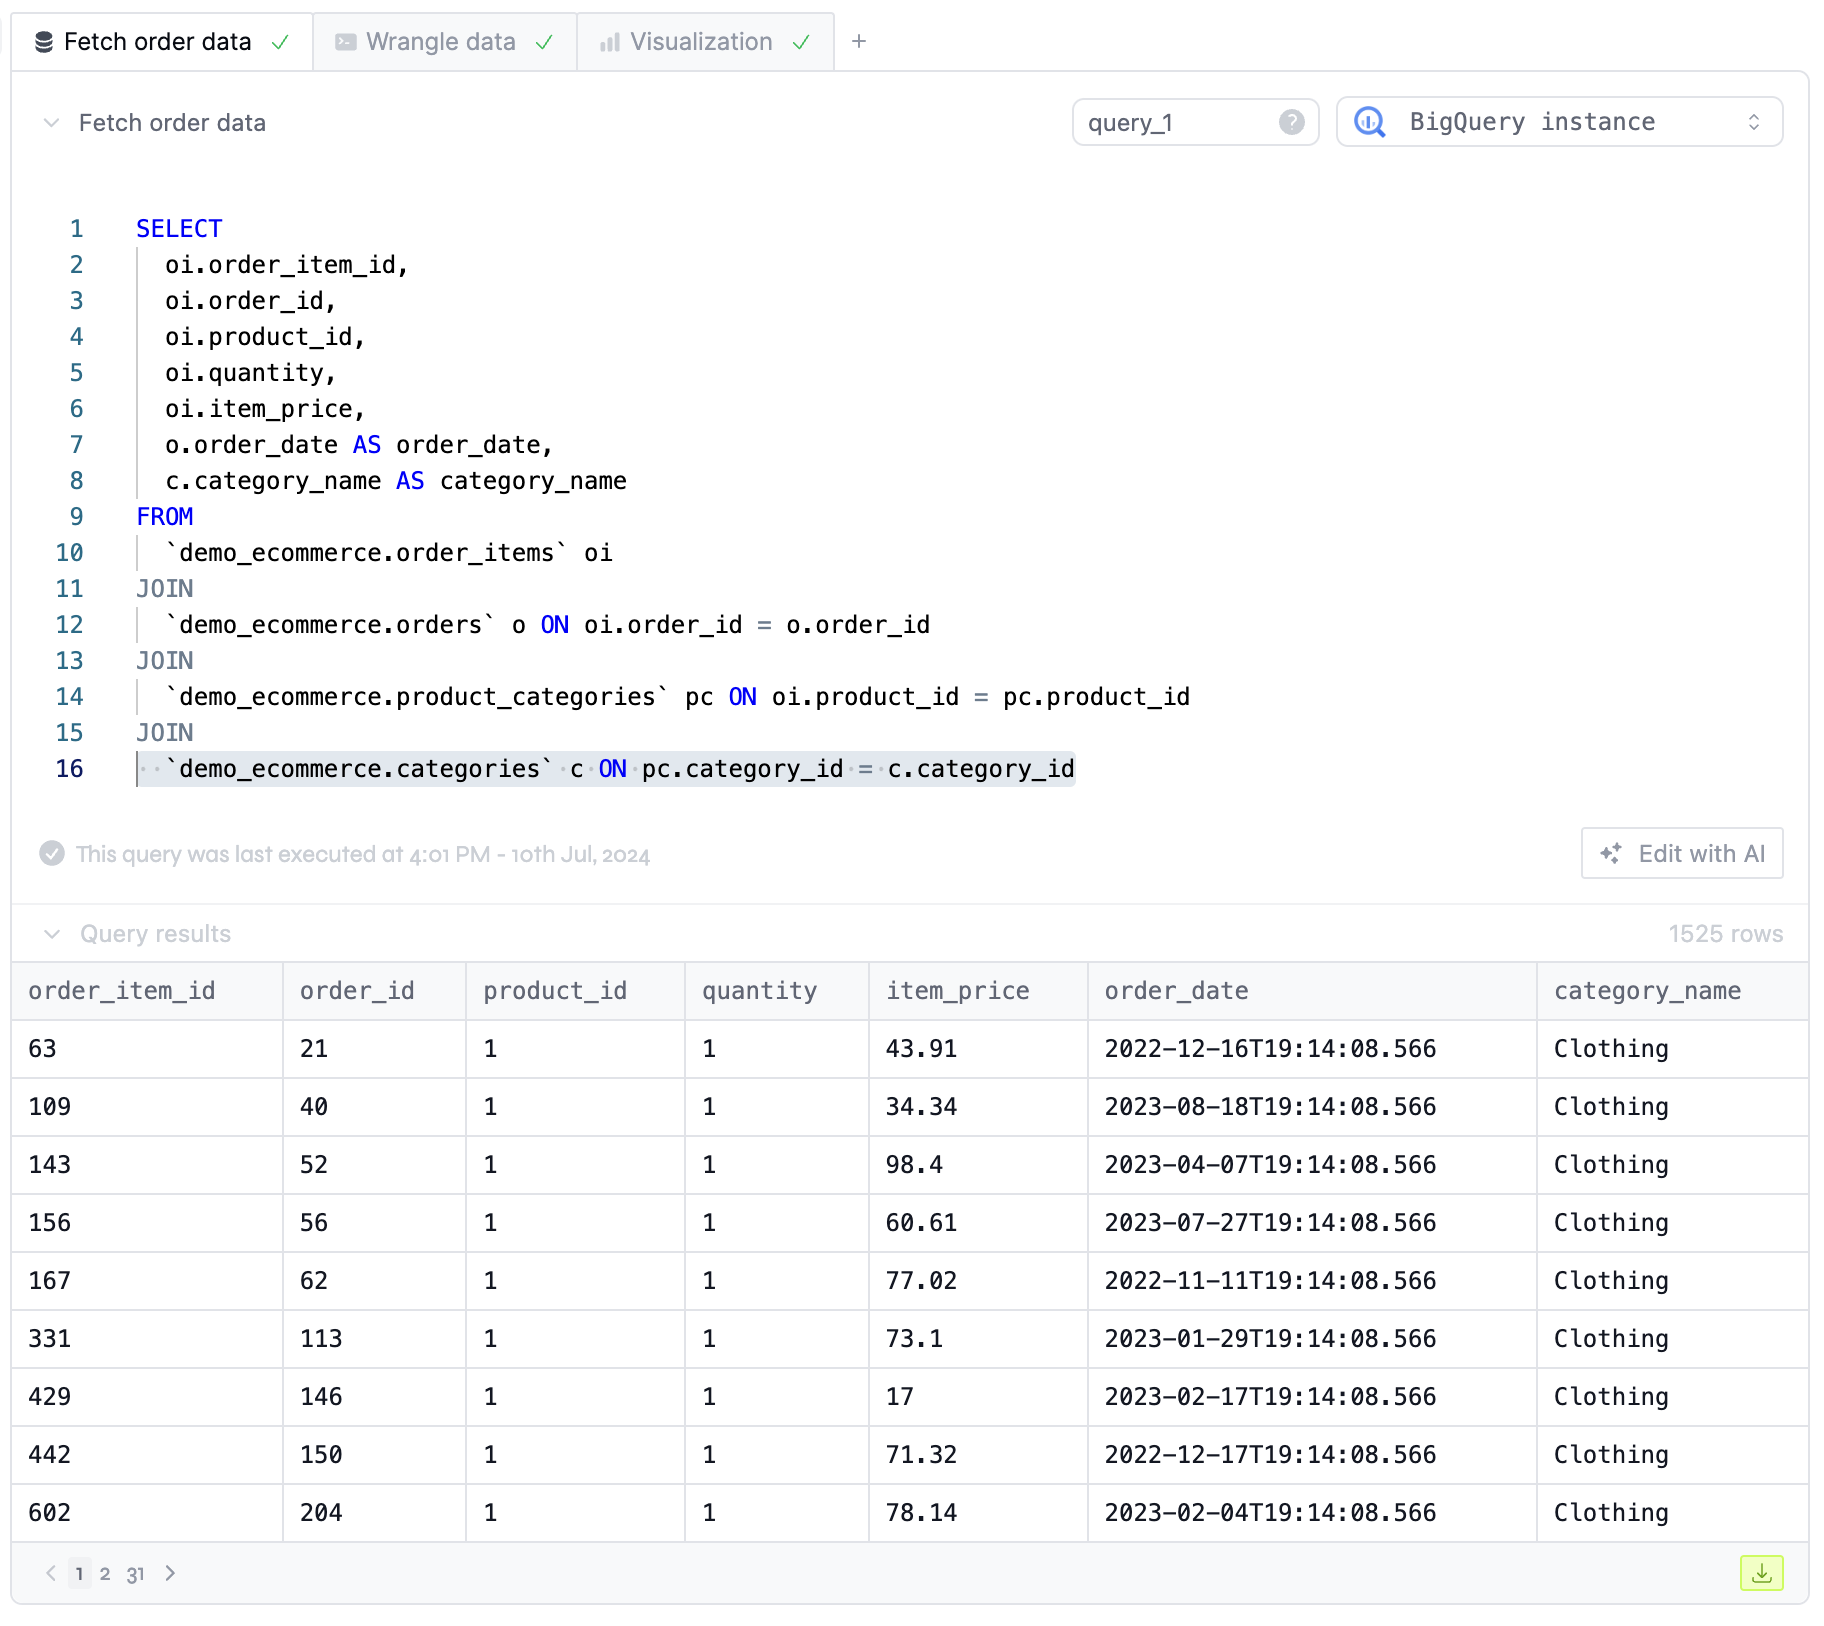
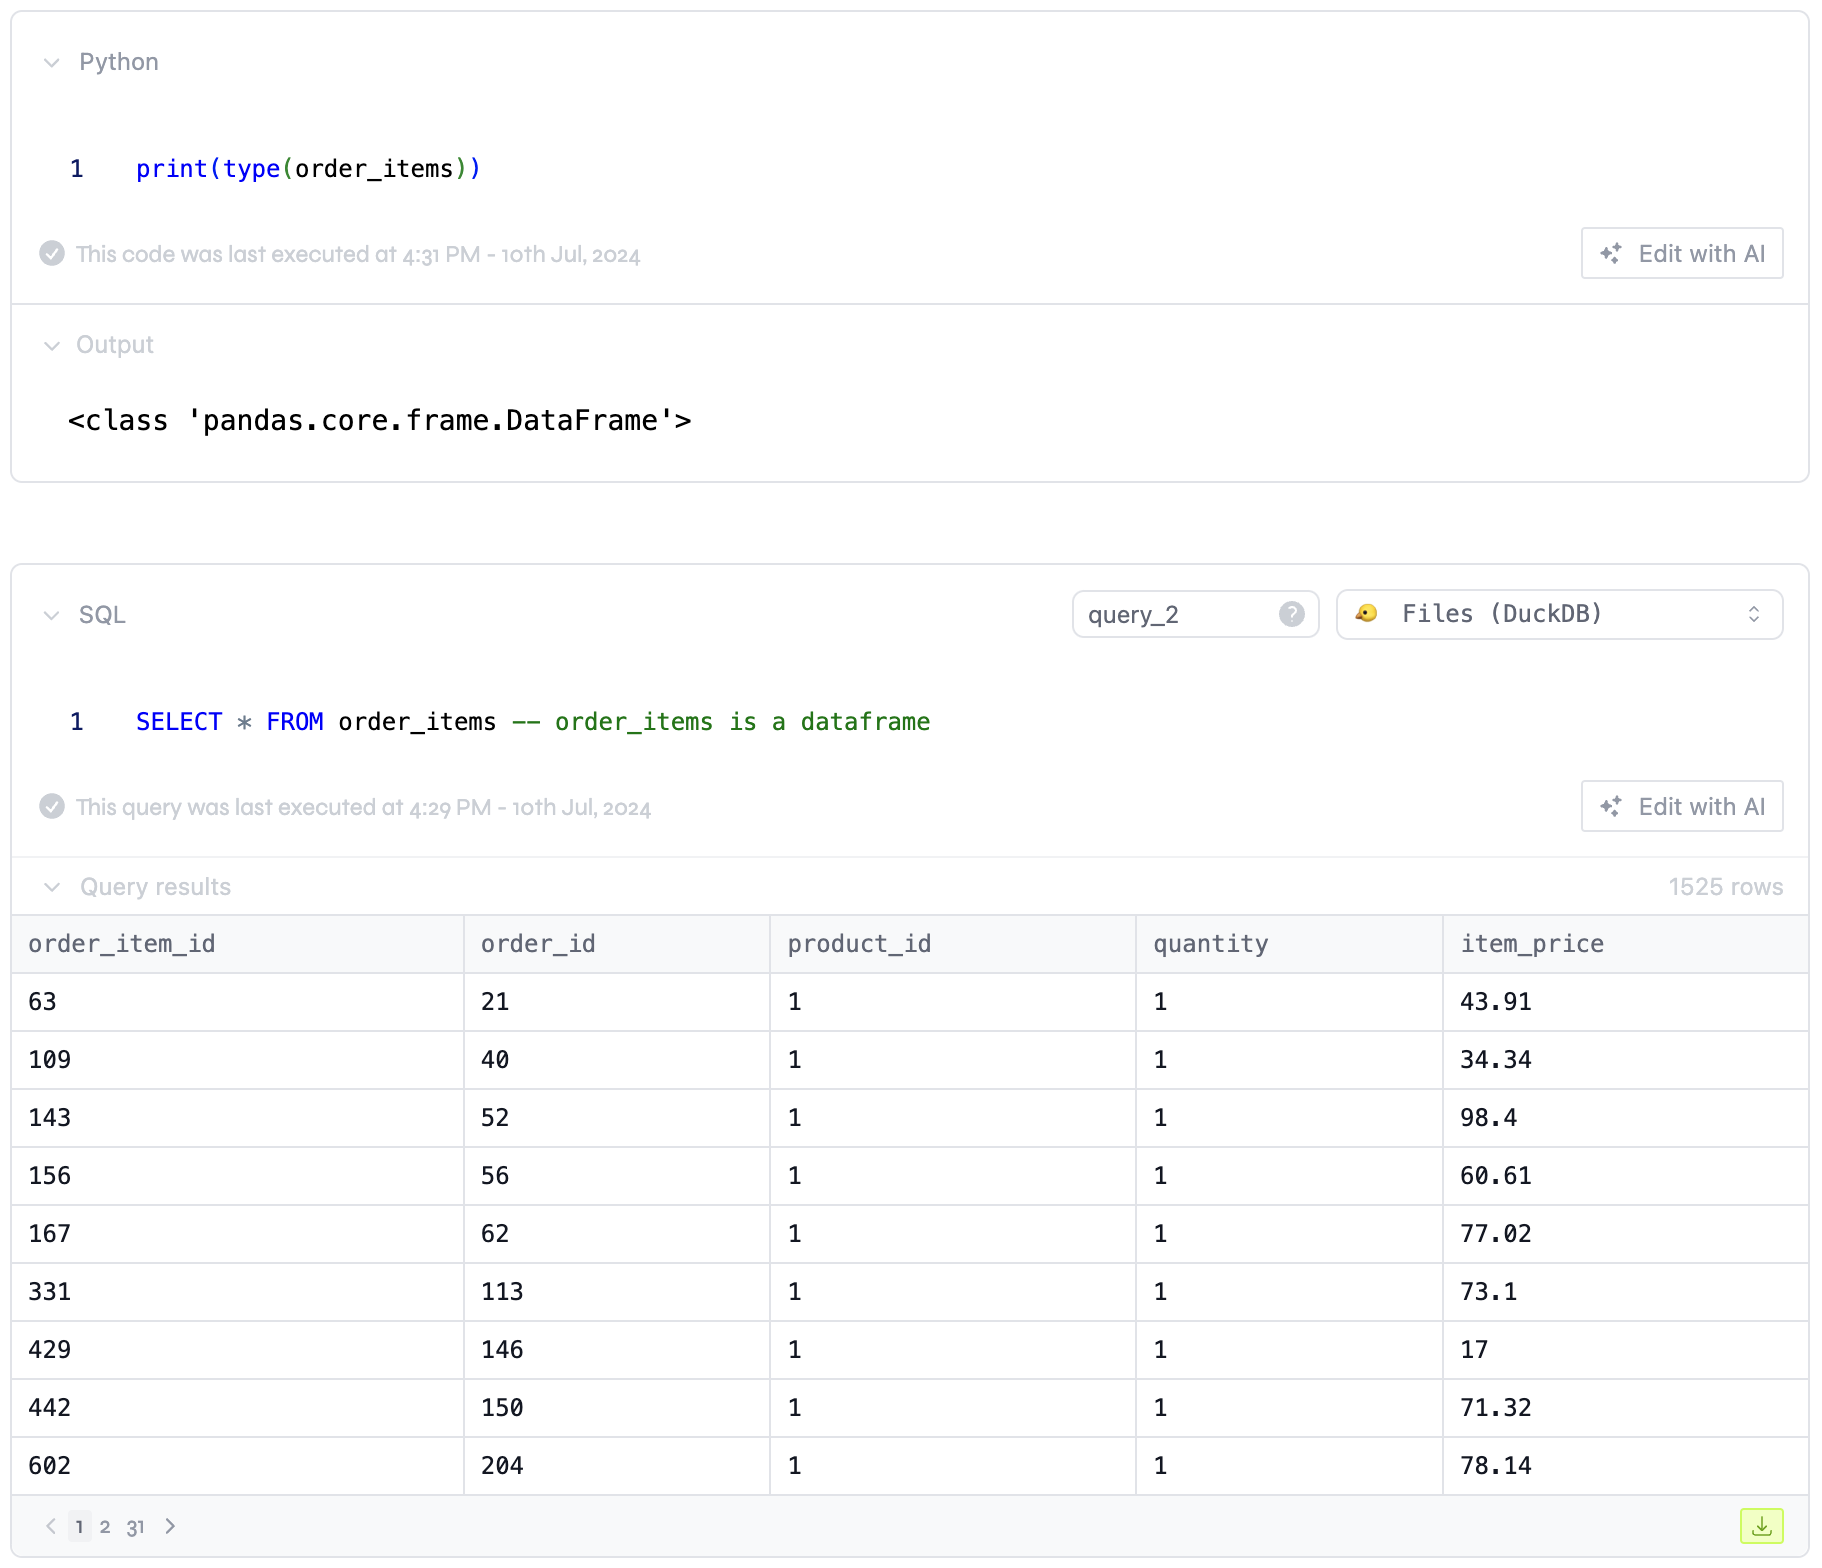
We also know that queries are useless unless you can wrangle the data, so each query's results are automatically converted into a pandas dataframe.
Then we went full circle and allowed people to write SQL queries against their pandas dataframes. We did that because sometimes the declarative style of SQL makes it a better choice than Python.
4. Not collaborative
The fourth thing I don't like about notebooks is that I can't edit them at the same time as someone else. I also don't like it that I have to push my changes to GitHub and then someone else has to pull these changes to see what I'm doing.
We fixed that by using Yjs to store the notebook's state.
Whenever you create a block, delete a block, or move a block, we send that information to Yjs, and then Yjs sends it to everyone else who's viewing the notebook.
If two people try to edit the same block at the same time, Yjs knows how to merge their changes, so no one loses their work.
5. Outdated results
The fifth thing I don't like about notebooks is that they get stale, and you have to re-run them manually to get the latest results.
Let's say you have a sales forecast notebook built on top of the latest CRM data. In that case, Jamie from the sales team will probably ask you to re-run the notebook every week or so to get the latest forecast.
We fixed that by adding a "schedule" button that allows you to run a notebook at a specific time, like every Monday at 9 am.
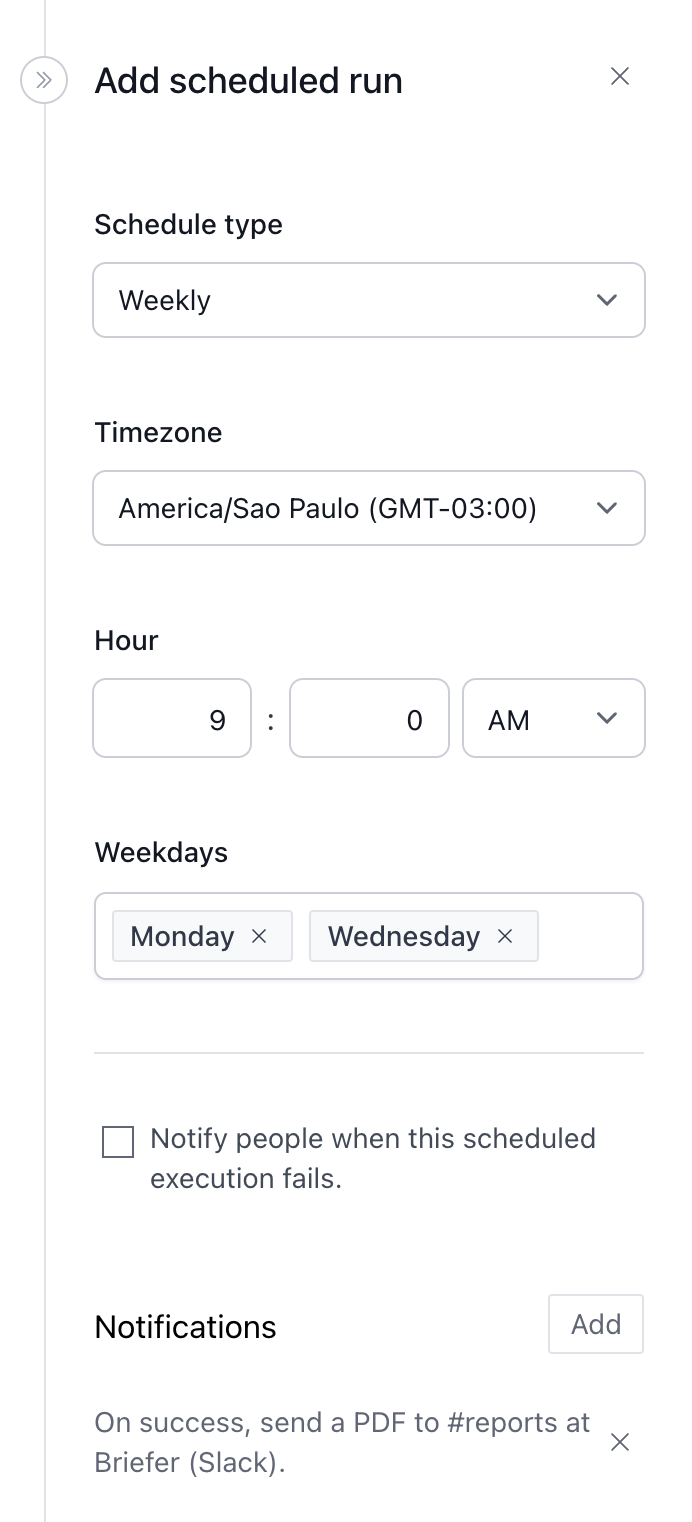
If the notebook fails to run, we can send you an email or a Slack message. Otherwise, we can send you the complete notebook in PDF format on those same channels.
I love the notifications feature, but some people overuse it. They schedule their notebooks to run every few minutes and then get mad when they get too many notifications. We don't know how to solve that problem yet.
6. Not interactive
The sixth thing I don't like about notebooks is that they're not interactive.
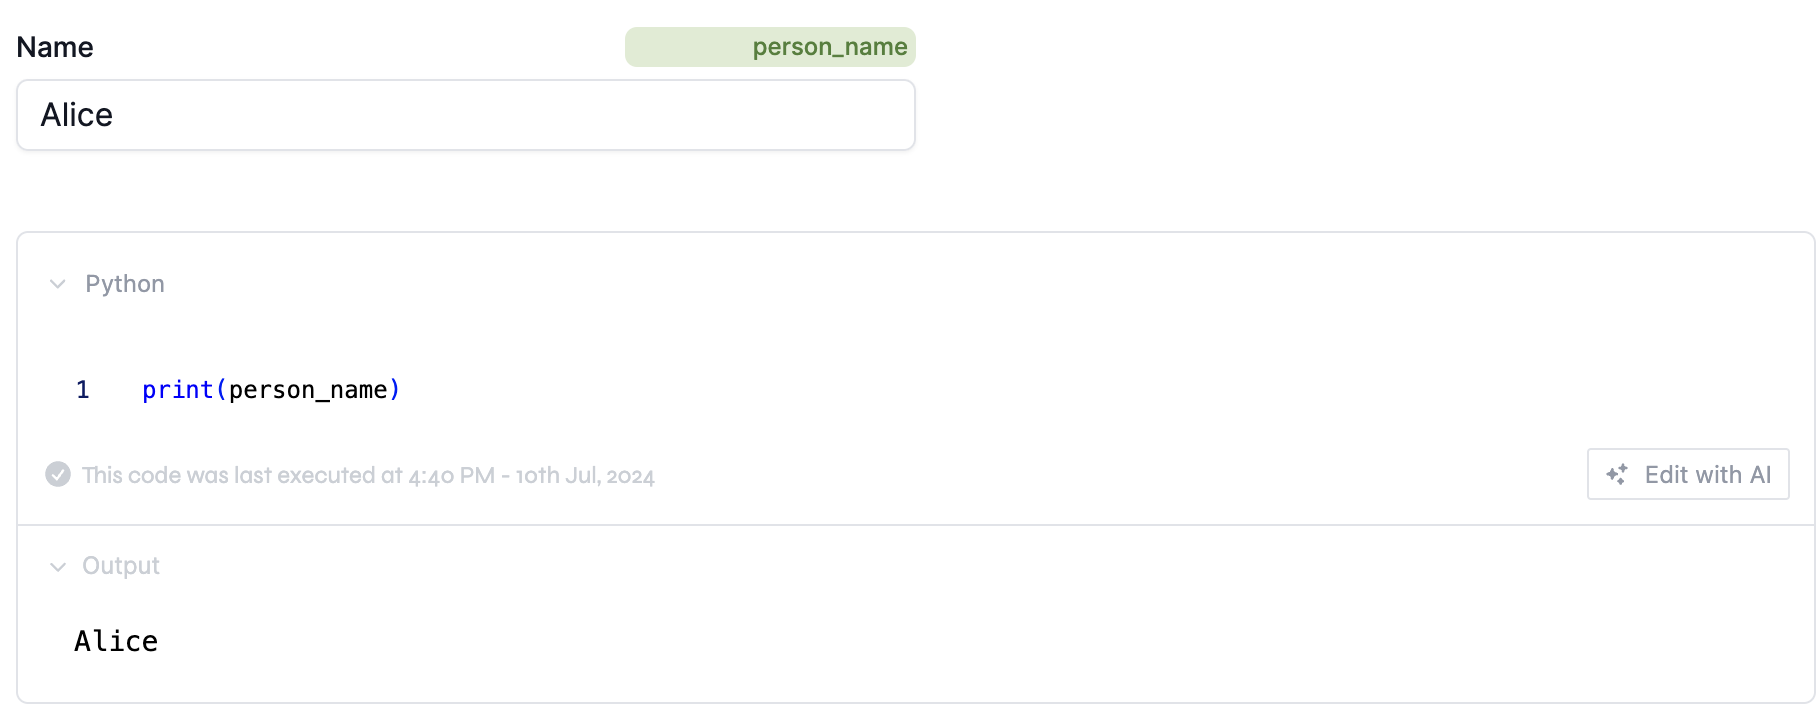
We fixed that by adding a few native text fields and dropdown blocks that allow you to ask for user input.
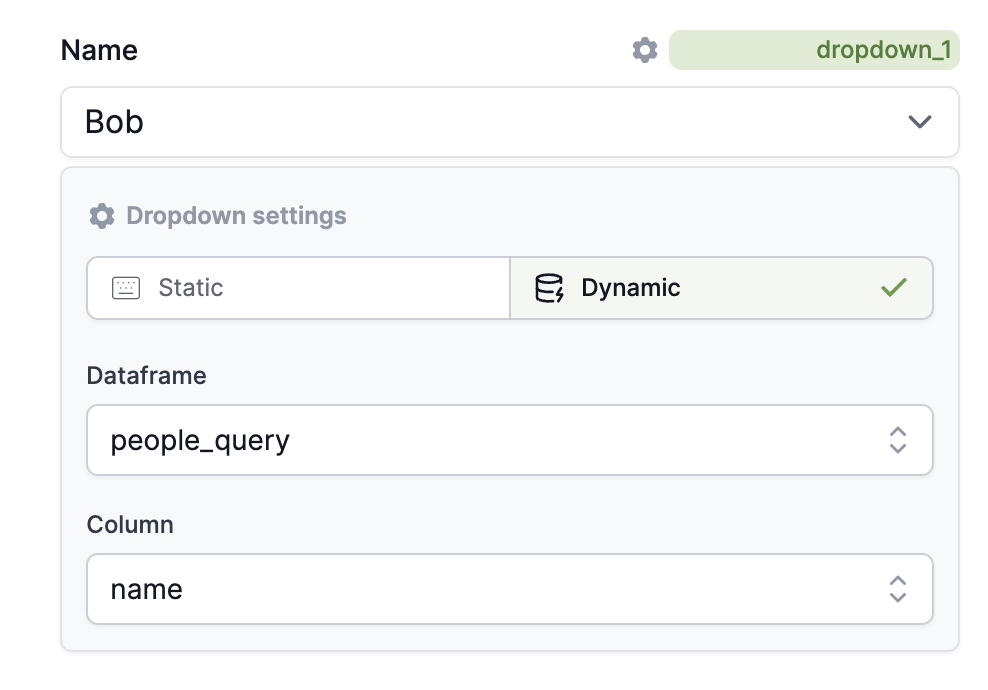
We know that users sometimes want their inputs to be dynamic, like when they want to use values from their databases as options in a dropdown, so we did that too.
We do know about ipywidgets, but we don't like them because they get lost among the other blocks, and their styling is not consistent with the rest of the notebook.
7. Friction to plot graphs
The seventh (and final) thing I don't like about notebooks is that plotting simple graphs requires more code than it should.
Whenever I need a simple line chart, I have to write a few lines of Python code, and then I have to do all the styling manually. Otherwise, the chart looks like it was made in Excel.
Additionally, I keep having to look up the documentation to remember how to plot anything other than basic charts.
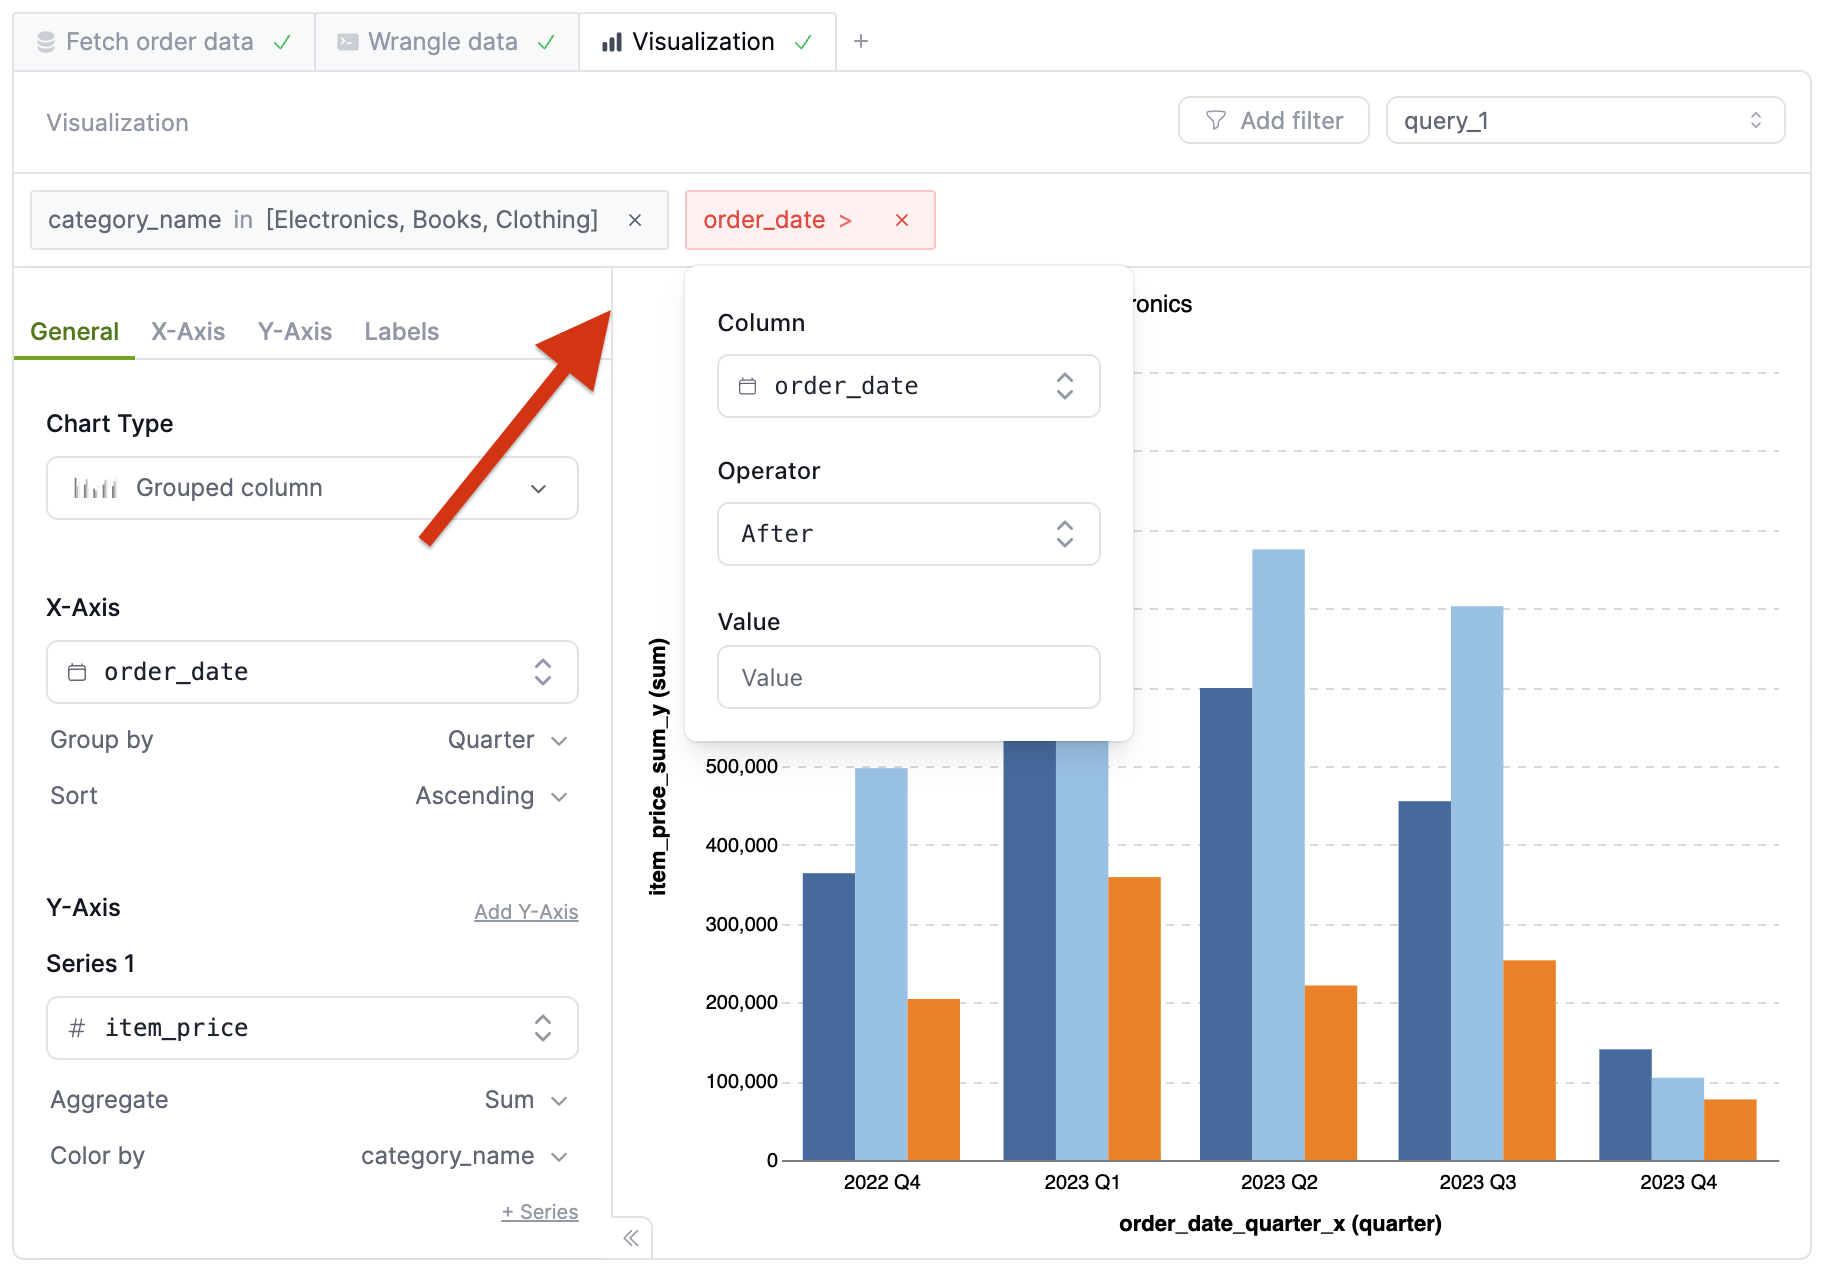
We solved that by adding "visualization blocks" that allow people to plot data by clicking buttons instead.
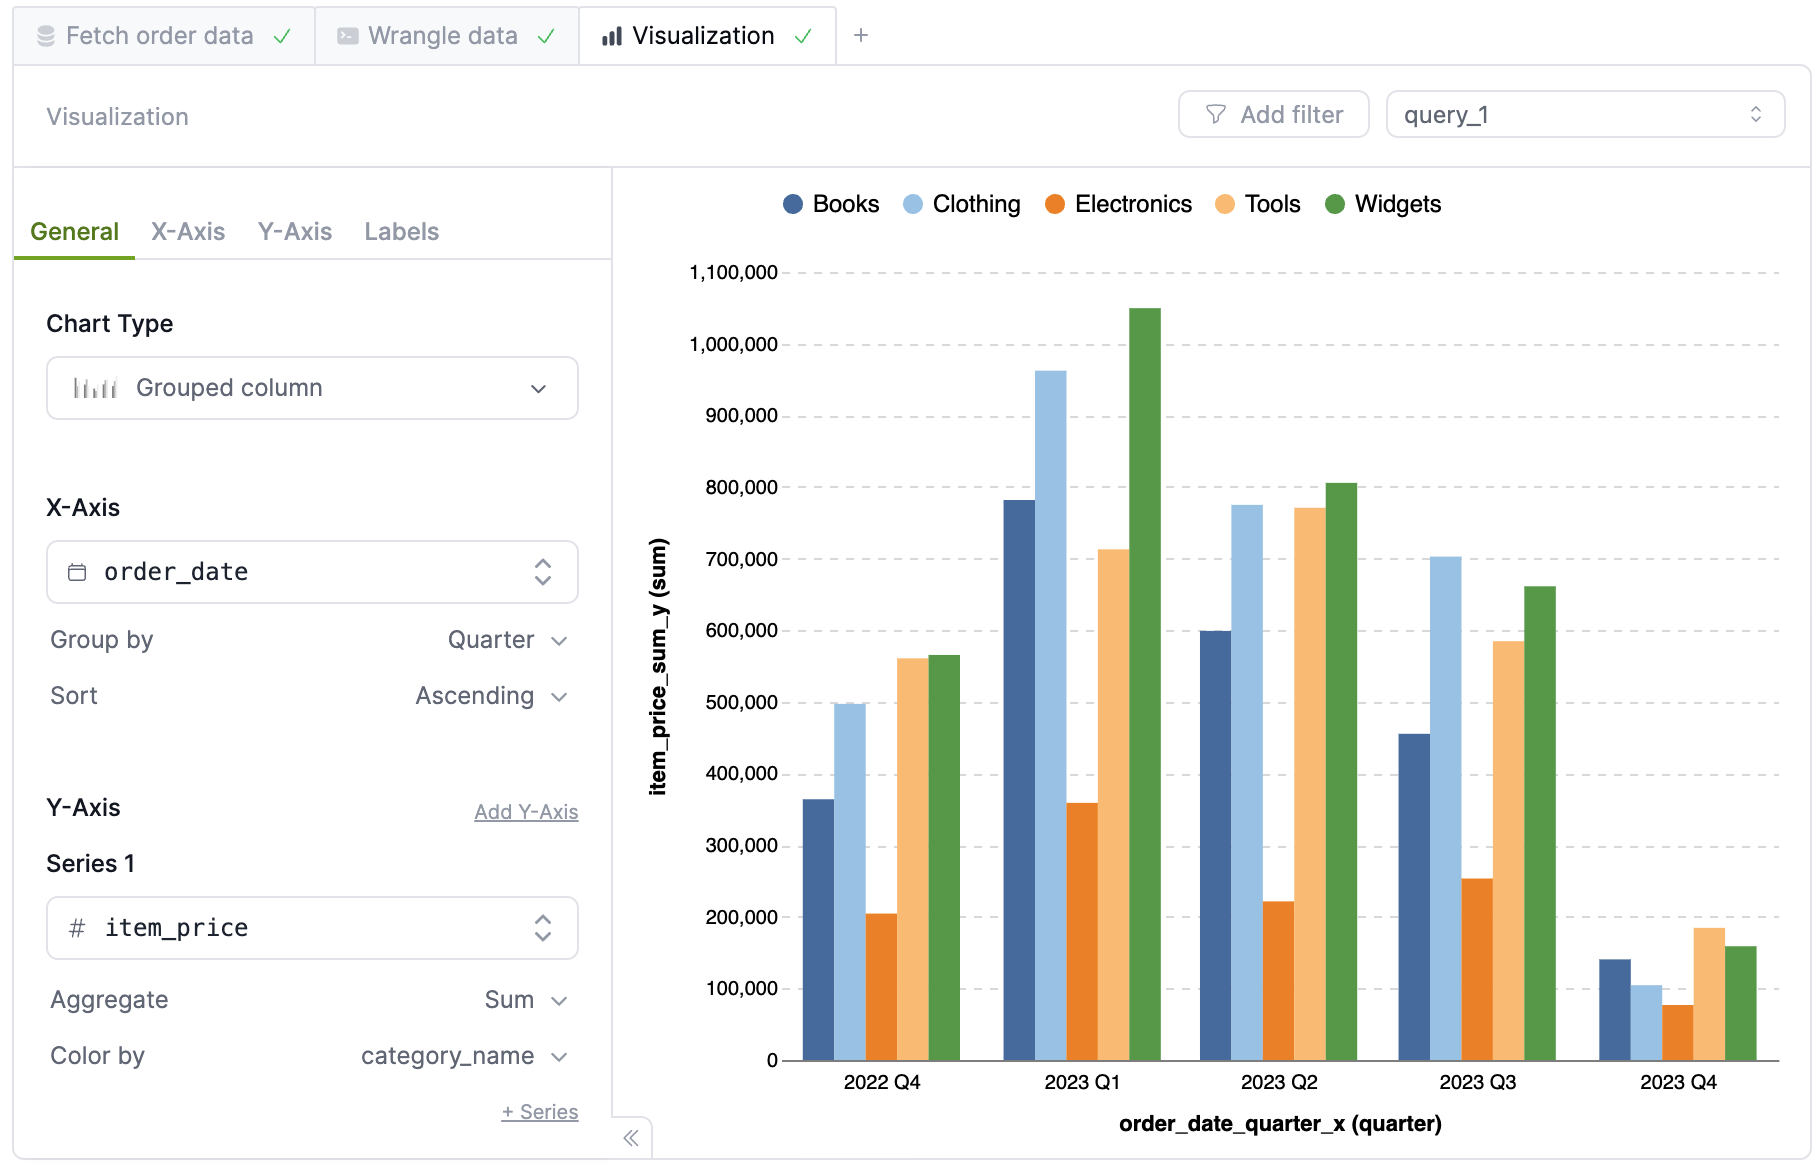
These blocks look good by default (at least that's what we think) and you can use them to plot data from any dataframe, which is key for visual engagement.
Some people complained about having to filter data using Python before plotting it, so we added a "filter" button to the visualization blocks too.
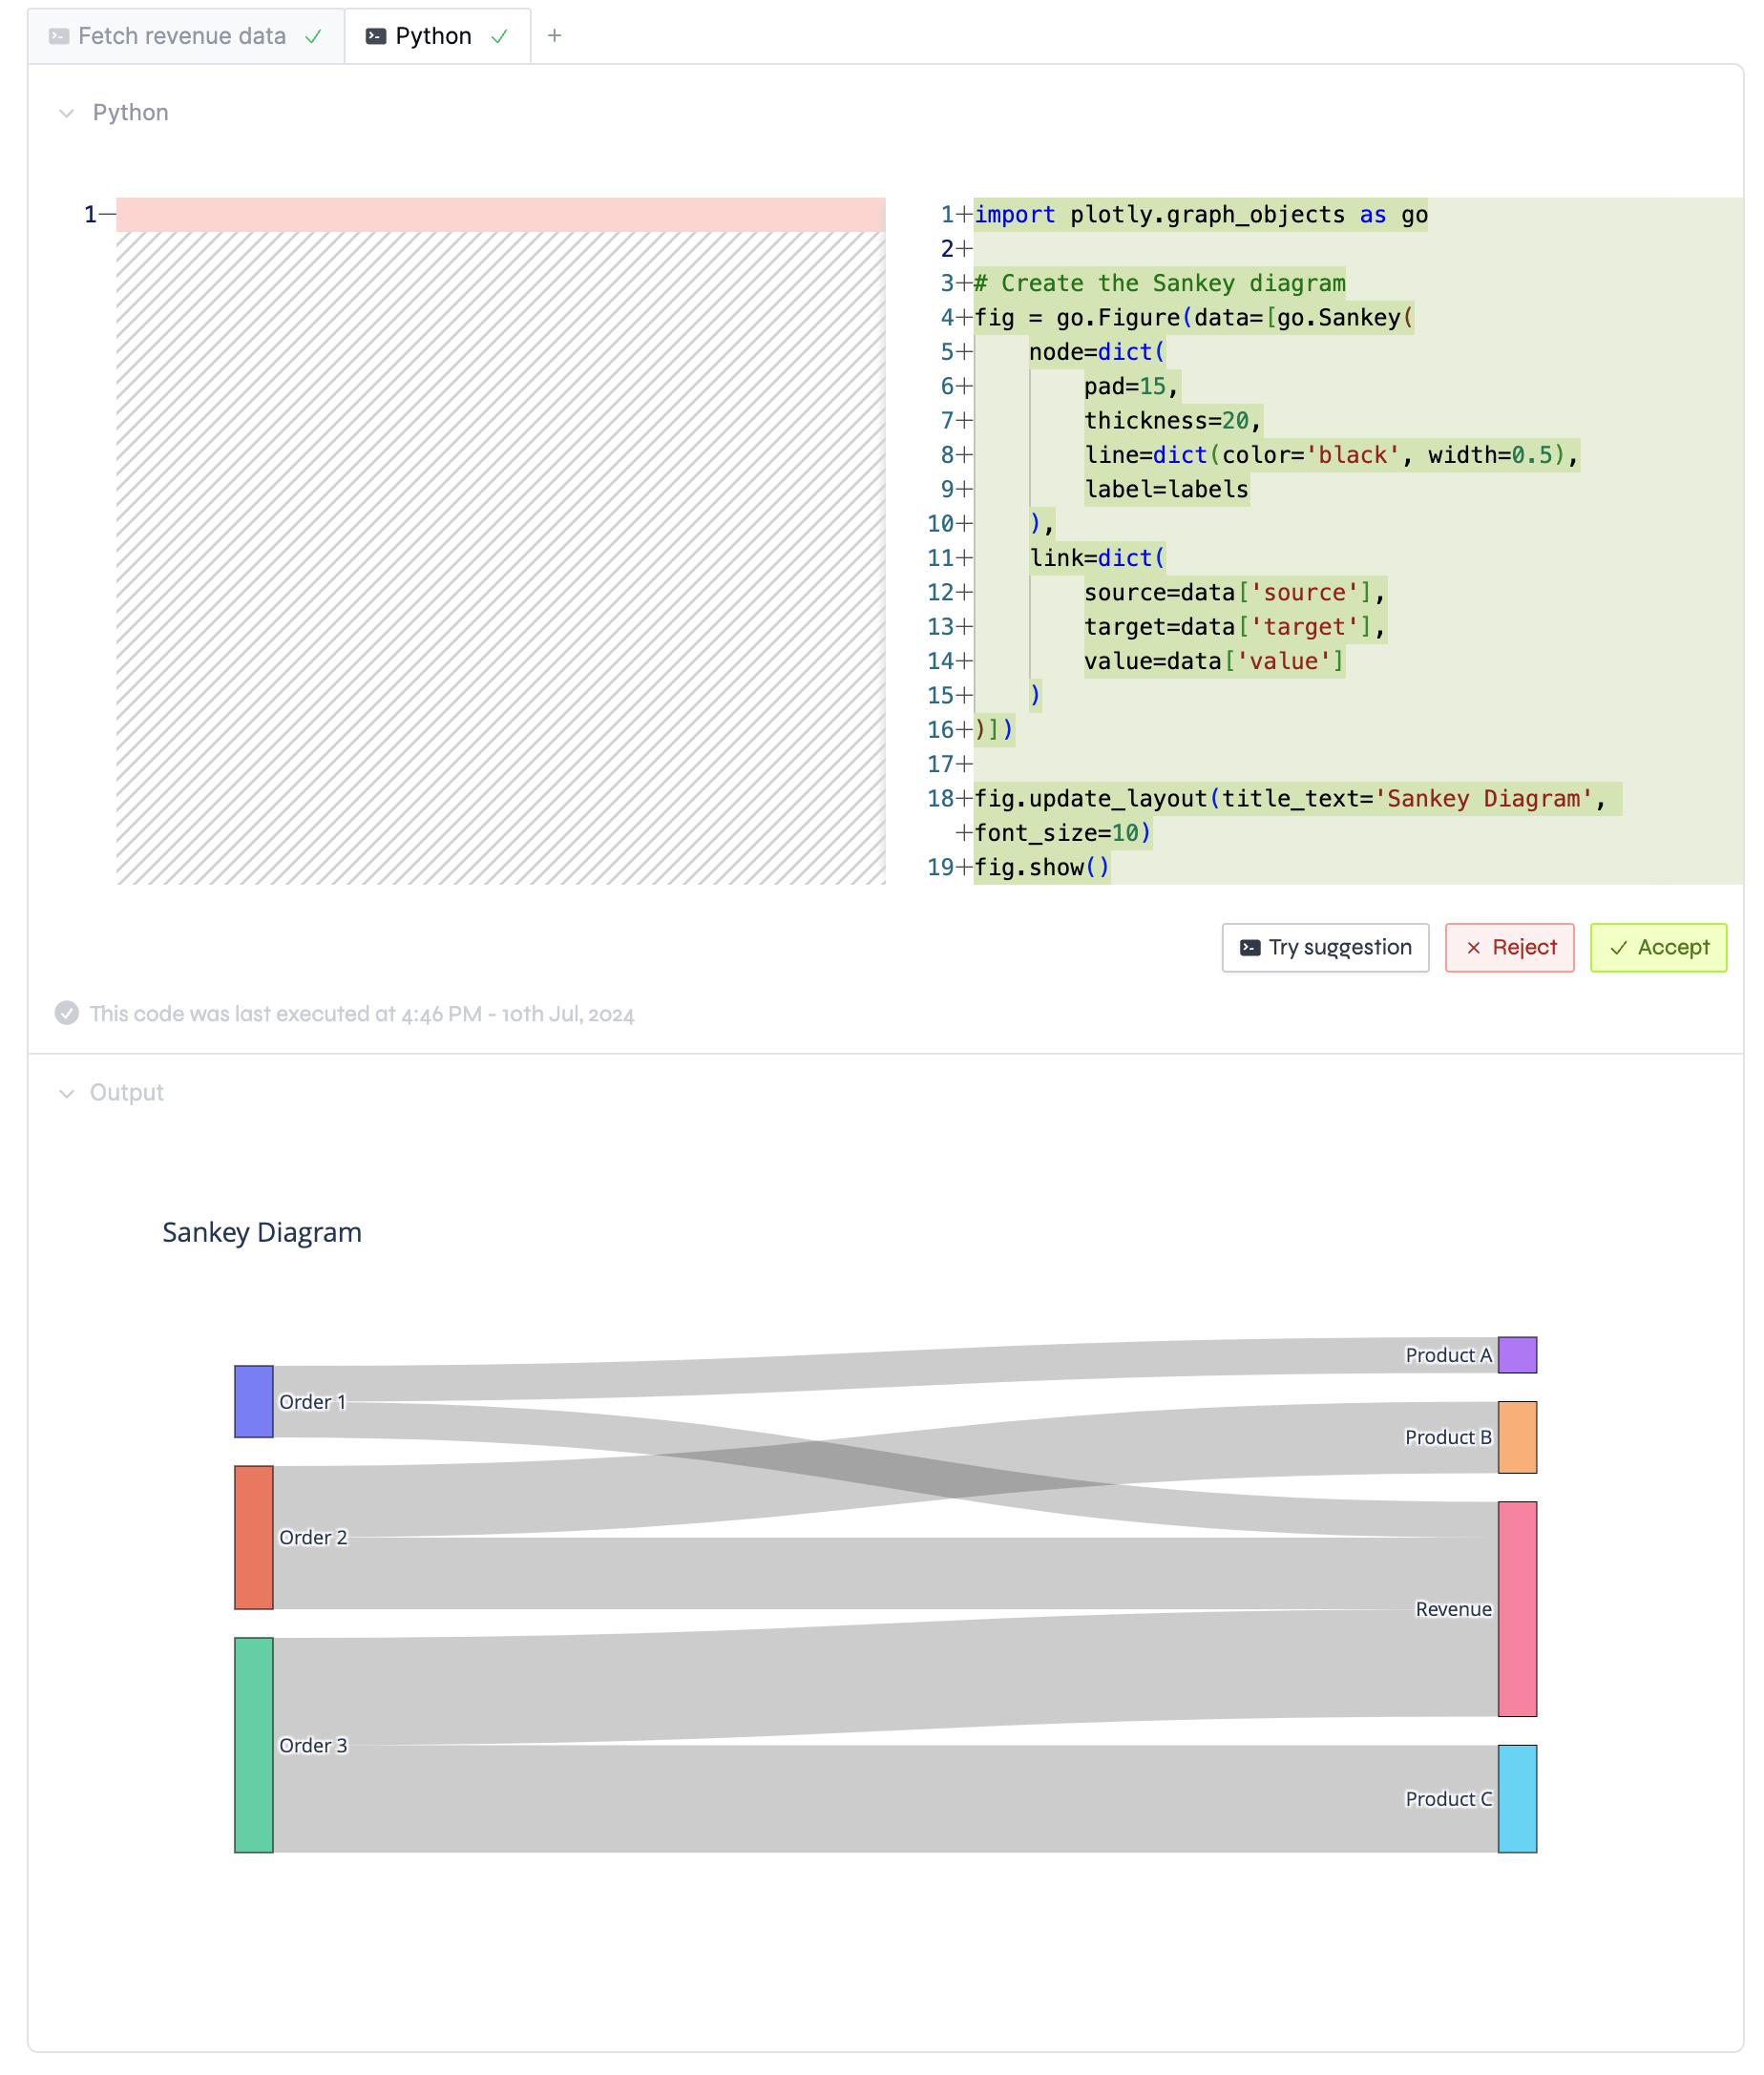
Still, sometimes people need to use Python to plot more complex graphs, like when they want to plot a sankey diagram or a network graph. In that case, they can click "edit with AI" and ask the LLM to plot the graph for them. That way, they don't have to read the documentation every time they need to plot something new.