
The first lesson I learned about logarithms is not to mention them when speaking to a large crowd. All the other lessons sucked, so I thought I'd create my own.
Let's start by talking about the simplest of linear scales: a ruler.
Everyone understands how rulers work: you place them next to tiny trinkets and you look at the ruler's marks to determine the object's size. You can then use a pen and the ruler's marks to represent the size of these objects on a board.
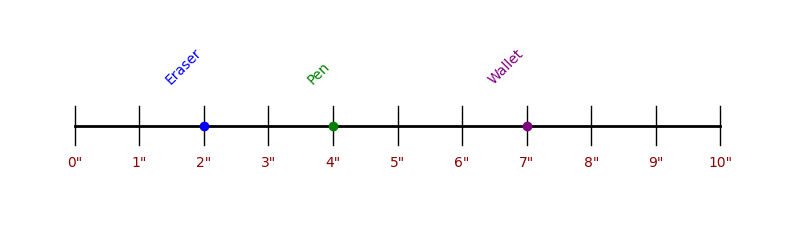
The problem with rulers is that you can't use them to measure larger objects, such as trees, park benches, and city blocks. To solve that problem, we'll need a bit of imagination.
Instead of having each of our ruler's marks represent 1 inch, we'll pretend they represent 100 inches. That way, we'll compress larger distances into smaller ones.
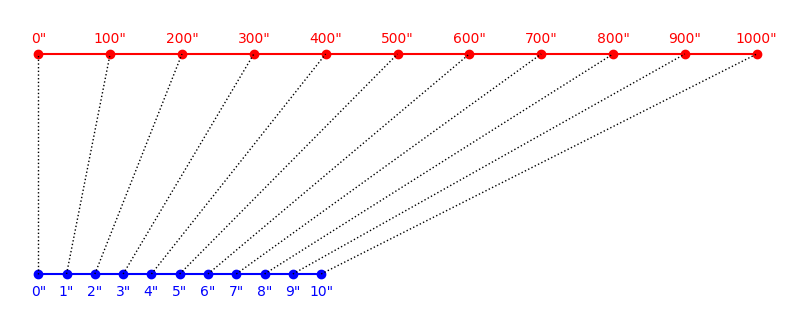
Now, we can use the same ruler to represent the size of a park bench, a tree, and even a city block.
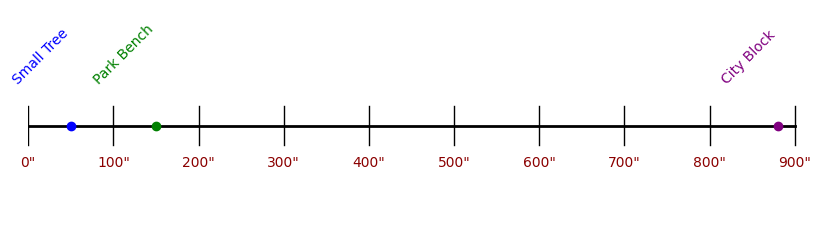
Notice how we're not using the ruler for measuring anymore. Instead, we're using it to represent the sizes of different objects.
The way we squished hundreds of inches into one mark on the ruler is called a linear transformation because when you draw it on a graph, it makes a straight line. Each mark on the ruler represents 100 more inches, showing a steady, even increase.
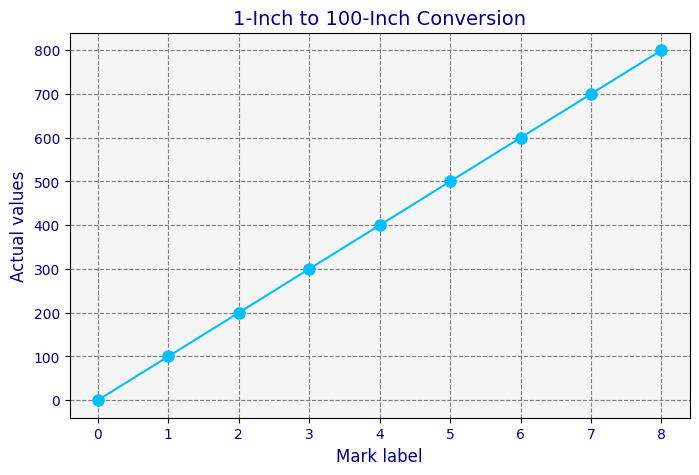
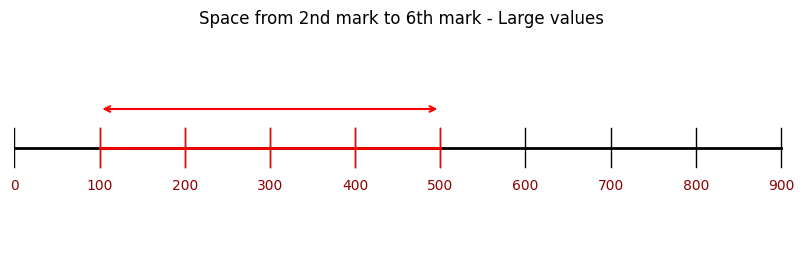
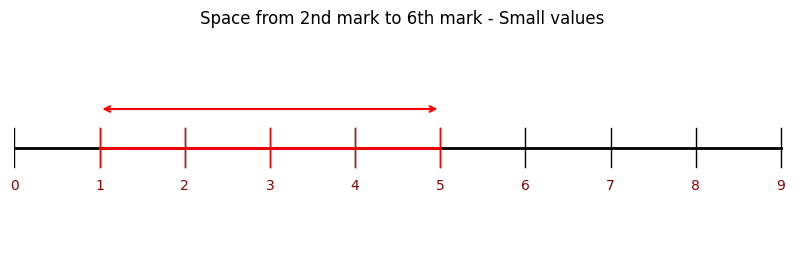
Linear transformations preserve the measurements' relative spaces.
For instance, if the marks for 1 and 5 inches are 4 segments apart on a ruler, then the marks for 100 and 500 inches will also be 4 segments apart when we use our scaled-up ruler. That way, the proportional distances remain the same, even though the actual measurements have increased.
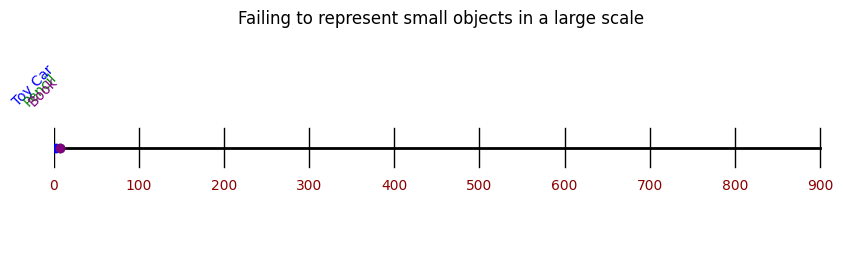
The problem with applying a linear transformation to a ruler is that it can only either measure small trinkets or large objects, not both.
A ruler scaled from 0 to 10 inches isn't big enough to measure a park bench, while a ruler scaled from 0 to 900 inches makes it hard to distinguish the marks for smaller objects — they become too close together.
To solve this problem, we'll need to transform our ruler so that each segment represents a greater increase.
Typically, going from the first mark to the second represents a 1-inch increase, just like there's a 1-inch increase when going from the second mark to the third. In other words, segments in normal rulers represent linear increases.
In our new scale, going from the first mark to the second represents a 10-inch increase, and going from the second to the third mark represents a 100-inch increase. Each subsequent segment represents a distance ten times greater than the previous. In this case, each segment represents a non-linear increase.
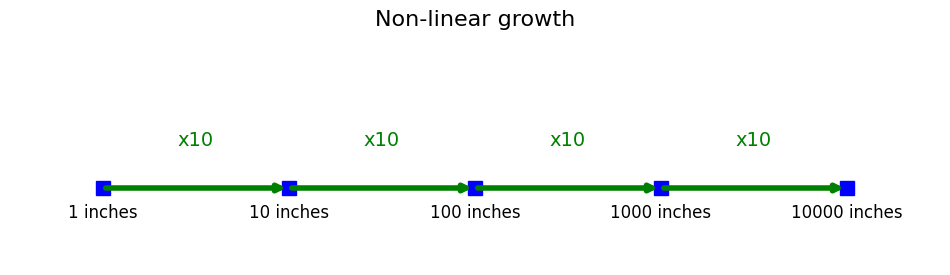
This way, with just 10 marks, you can represent objects from 1 inch to 100,000,000 inches. Each step exponentially increases the range we can measure without cluttering our ruler with countless tiny increments.
Now, you can represent tiny stones at the first mark and a mountain just 10 segments further because, by the time you get to the 10th mark, the value this mark represents hasn't just grown tenfold, it's grown 10¹⁰ inches.
Here's another example using our new scale. If you plot a cockroach in the scale's first mark, a badger in the second mark, and a troll in the third, it means that the badger is 10x larger than the cockroach and that the troll is 10x larger than the badger.
Furthermore, it shows that the troll is 100x larger than the cockroach, because they're 2 segments apart, so 100 (10²) times larger.
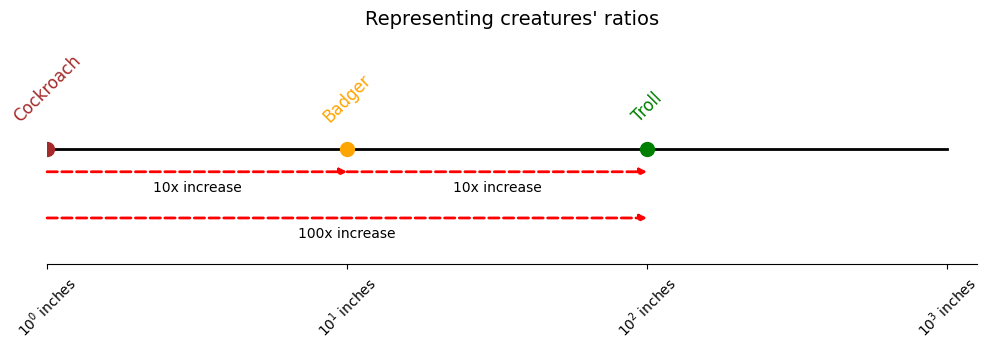
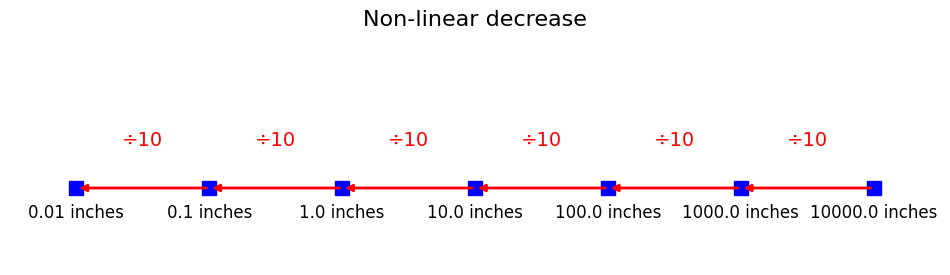
Going left has the opposite effect, it causes things to become increasingly smaller. If you keep going left from 1, you'll start working with fractions, and they get 10x as small as you move on to the leftward mark.
As we've just demonstrated, this type of scale is great for representing ratios.
Now compare how the represented values increase exponentially as you move up marks. See how it's not a linear growth like in the previous transformation?
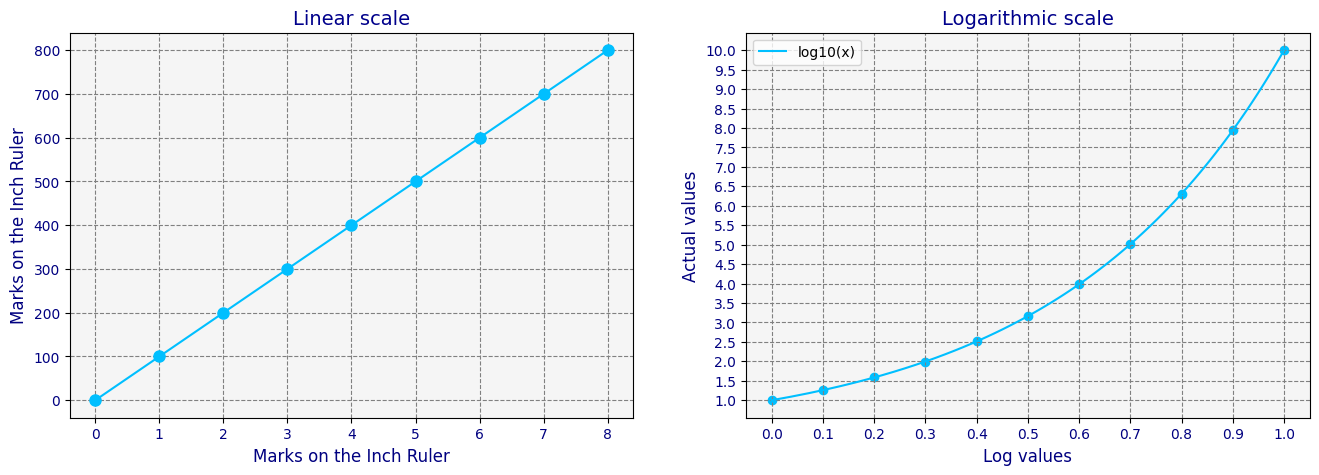
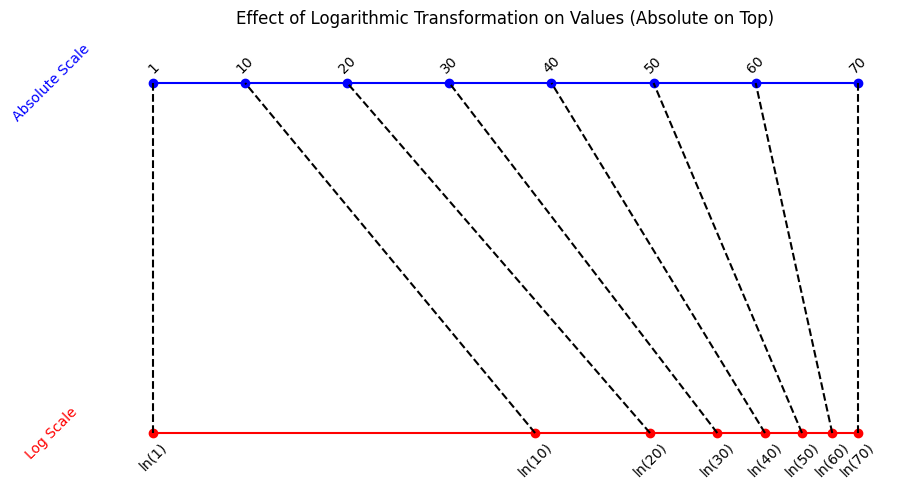
As shown above, each mark represents an exponential increase in the value it represents. Still, this type of scale is not an exponential scale. It's a logarithmic scale.
If you were to plot the actual values against their corresponding logarithmic values, you'd notice that it resembles the plot of a logarithmic function. This resemblance occurs because, as the actual values increase, the increase in their logarithmic values becomes increasingly smaller.
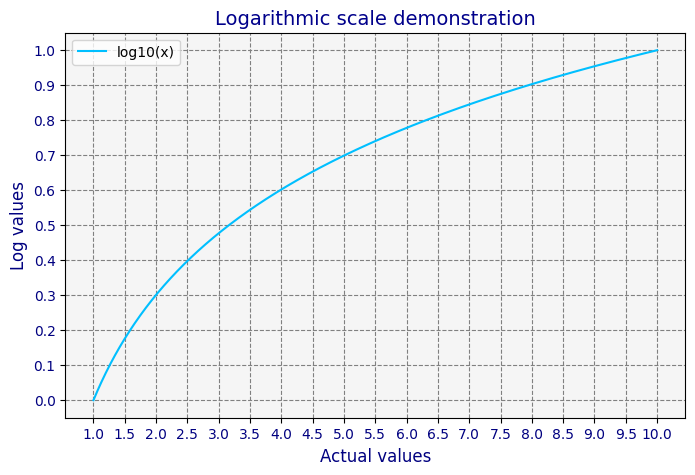
An interesting effect of using the logarithmic scale is that small values get relatively more distant, while larger values get relatively closer.
The reason you should care about this change in relative distances is because it may cause unintended distortions, or, in the case of ill-intentioned people, intended distortions.
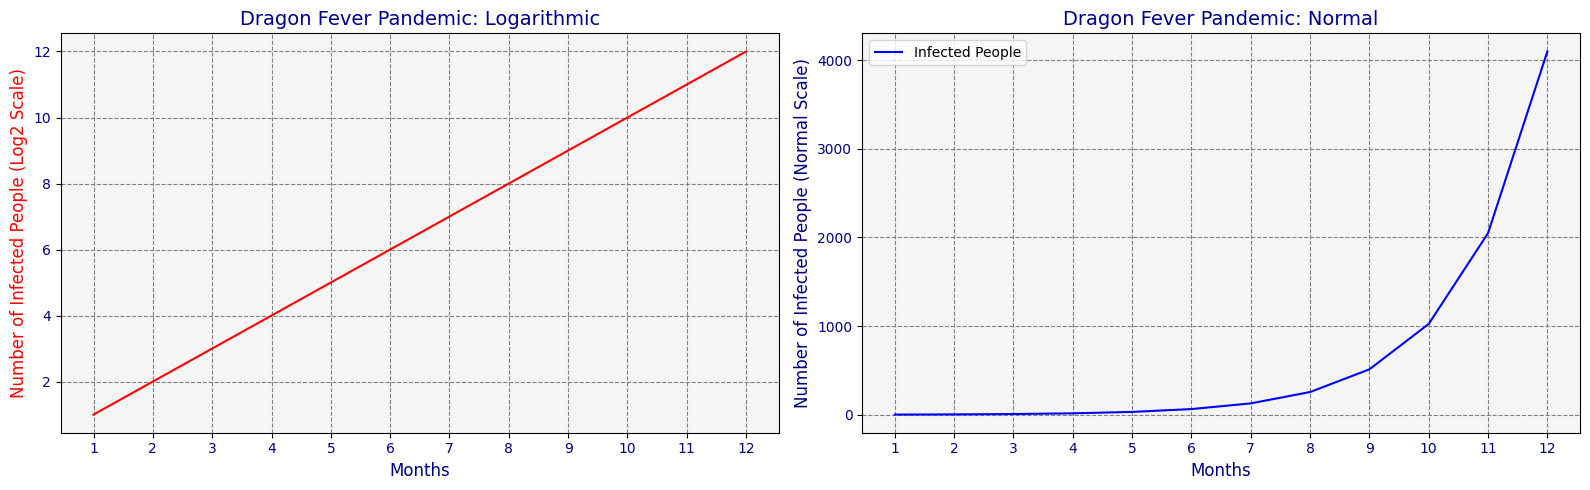
For example. Assume that a general council of alchemists doesn't want people to think there's a dragon fever pandemic. In that case, they can plot the number of infected people using a log scale, making it seem linear, when, in fact, it's exponential.
However, there might be compelling reasons behind the decision to use a logarithmic transformation for this chart.
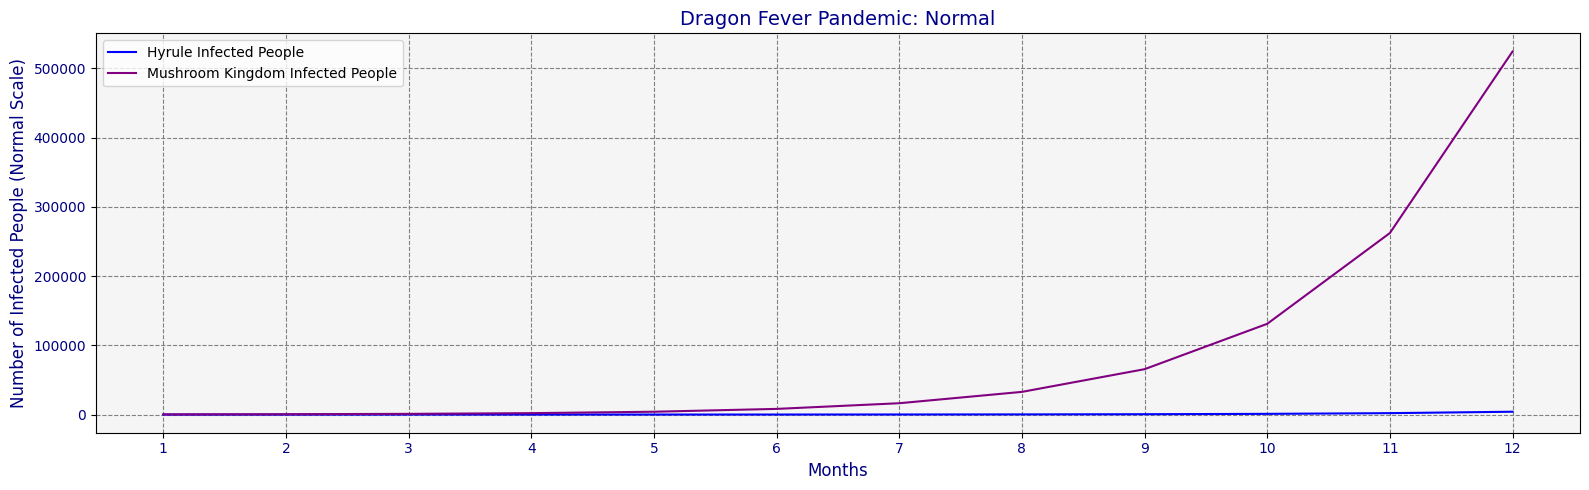
Imagine there are two kingdoms, Hyrule and the Mushroom Kingdom, each with vastly different population sizes. Hyrule has 10,000 inhabitants, while the Mushroom Kingdom boasts 10,000,000.
Now, let's say a disease outbreak occurs in both kingdoms, starting with 10 infected individuals in each. On a regular linear scale, the number of infected individuals in Hyrule might seem insignificant compared to the Mushroom Kingdom's numbers.
If we switch to a logarithmic scale, the picture changes. The slope of the curve representing the increase in infected individuals in both kingdoms becomes comparable. So, when the disease spreads from 10 to 100 infected individuals in Hyrule, the curve's slope remains consistent. Similarly, when the Mushroom Kingdom sees its infected population rise from 10,000 to 100,000, the slope of its curve mirrors that of Hyrule's.
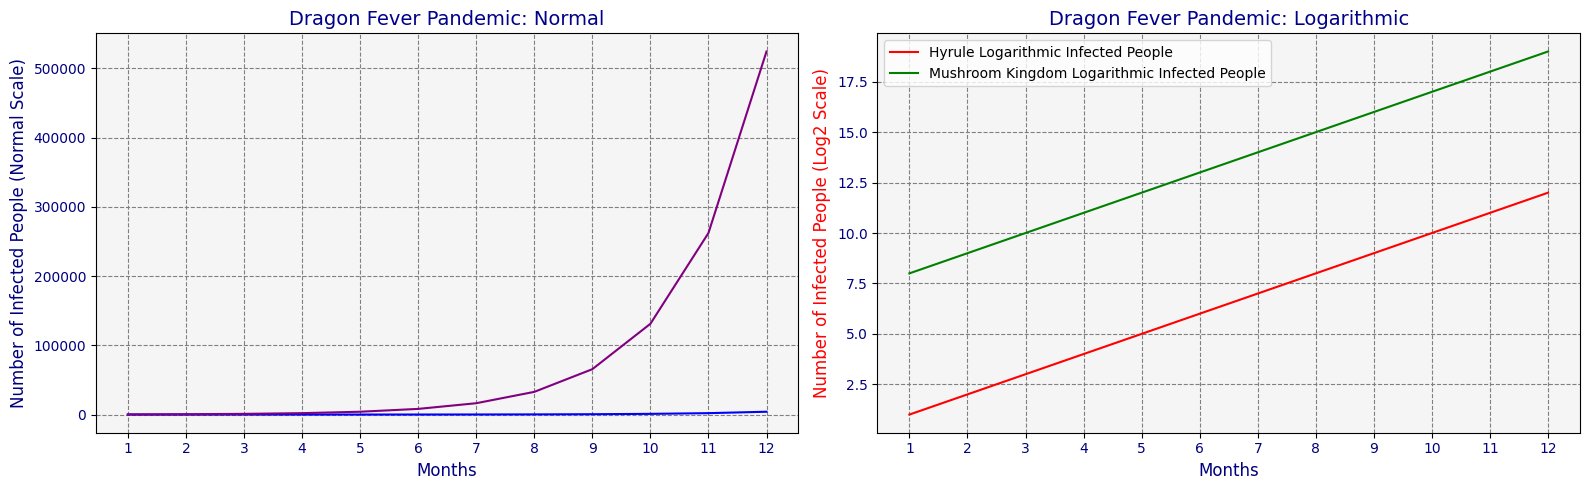
This scaling ensures that the threat level posed by the disease is communicated effectively in both kingdoms, regardless of their size. Without it, Hyrule's situation might appear deceptively less severe simply because of its smaller population. By utilizing a logarithmic scale, public health officials can accurately assess and address the risk posed by the disease in each kingdom, enabling more informed decision-making and resource allocation.
In addition to impacting visualizations, logarithmic transformations are also useful for statistical purposes, mostly because of:
- Symmetry. Logarithmic transformations may make data more balanced, which is essential for certain statistical techniques to work effectively.
- Homoscedasticity. Logarithmic transformations may help keep the spread of data consistent, which helps compare effects on different groups.
- Linearity. Logarithmic transformations may make it easier to see straight-line patterns in data, simplifying analysis.
Symmetry
A graph is symmetric concerning a line if reflecting the graph over that line leaves the graph unchanged.
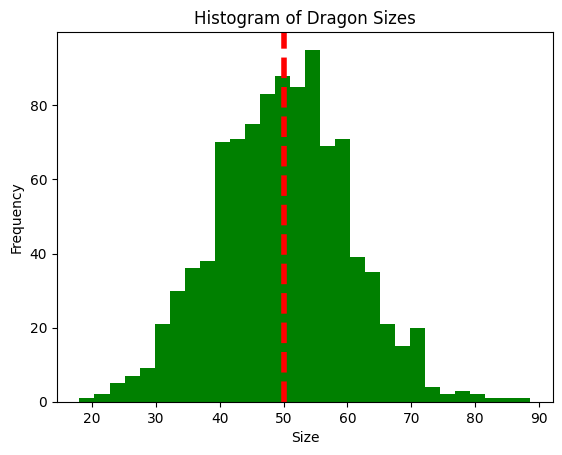
This histogram of dragon sizes is highly symmetric, for example.
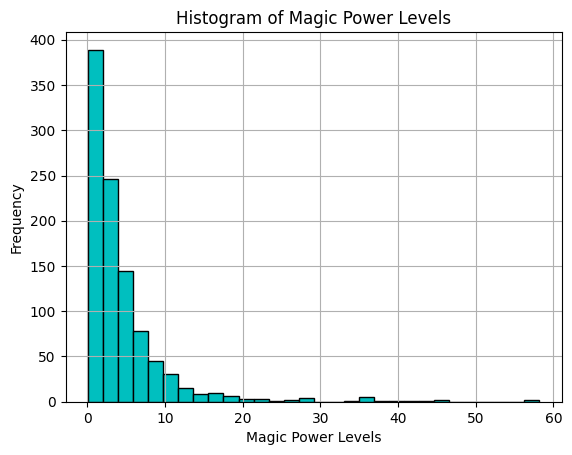
On the other hand, this graph of magic power levels in a sample of healthy wizards is not very symmetric. Instead, it's said to be positively skewed because of its long tail of results to the right.
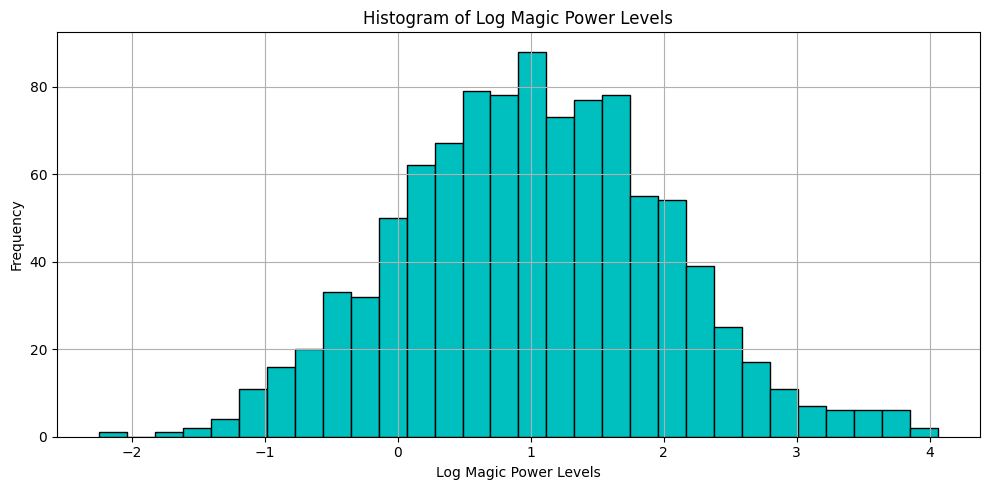
Now, pay attention to this magic trick: we can make this graph symmetric by applying a logarithmic transformation to all the magic power levels.
Such transformation makes these values more symmetric because the long tail of large values gets compressed, while the small values concentrated on the left get pushed farther apart.
Symmetry is vital in data analysis for various reasons. For example, when using statistical methods, we typically aim to find a mathematical model that accurately represents the distribution of our data. The choice of an appropriate model often depends on whether the data is symmetric.
Anyway, discussing the details of model selection is a topic for another time.
Homoscedasticity
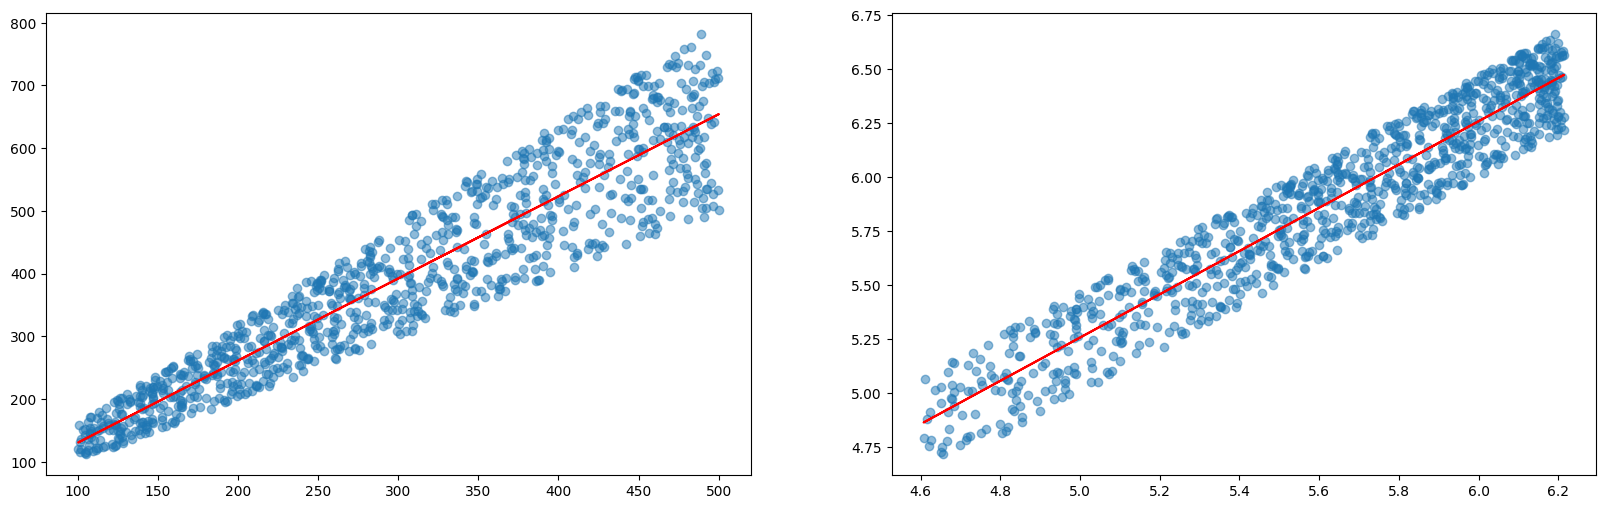
In the land of Skyrim, knights rely on magical potions to enhance their strength during battles.
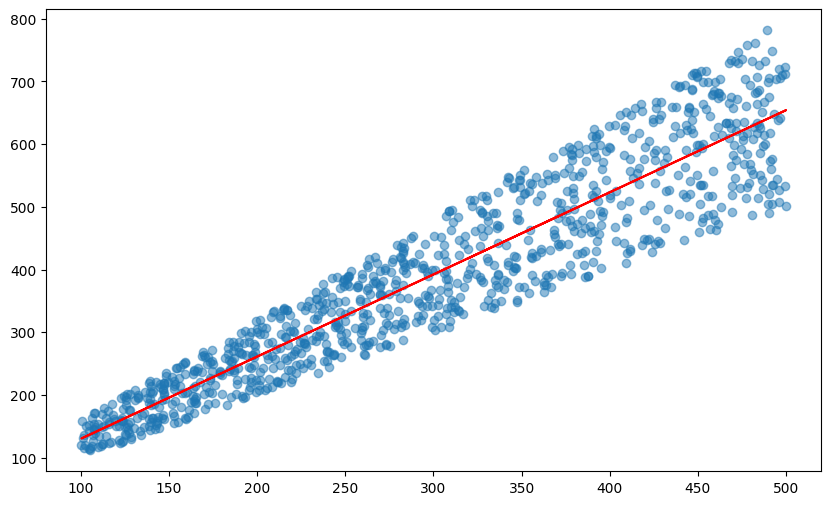
When we graph the effectiveness of these potions based on the initial strength of the knights, we notice greater variability in the potion's impact. This variability is a common occurrence with potions and medicines.
For instance, if a knight initially lifts 100 pounds, the potion might yield effects ranging from no change (100 pounds) to a significant increase (160 pounds, a gain of +60 pounds). Conversely, if a knight can lift 500 pounds, the potion's effects could range from maintaining the initial strength (500 pounds) to a substantial increase (800 pounds, a gain of +300 pounds).
When we plot this data on a linear scale, we notice that the variance increases as the knight's initial strength rises. This phenomenon, known as heteroscedasticity, reflects the heterogeneous nature of the data, where the variability of the potion's effects differs across the range of initial strengths.
When we apply a log transformation to our graphs, it makes the data more homoscedastic, meaning it evens out the variance, especially for stronger knights. In simpler terms, this means that the potion's effects become more consistent across different strength levels.
This transformation reveals that the potion consistently boosts strength by around 0 to 20%, making it easier to predict its benefits for knights at all training levels.
Linearity
Let's resort to our imagination again.
Let's say someone's aura indicates one's affinity with celestial magic, and Moonbeam Extract is said to degrade this connection.
Imagine a scenario where our kingdom's alchemists seek to understand the relationship between Moonbeam Extract and someone's aura.
When we plot people's aura's brilliance against Moonbeam Extract, we notice a curved pattern, with most data clustered at the lower left corner. That plot gives us some clues about the relationship between people's auras and Moonbeam Extract, but it's not very clear.
When we employ logarithmic transformations on both magical properties, the correlation appears straight and clear.
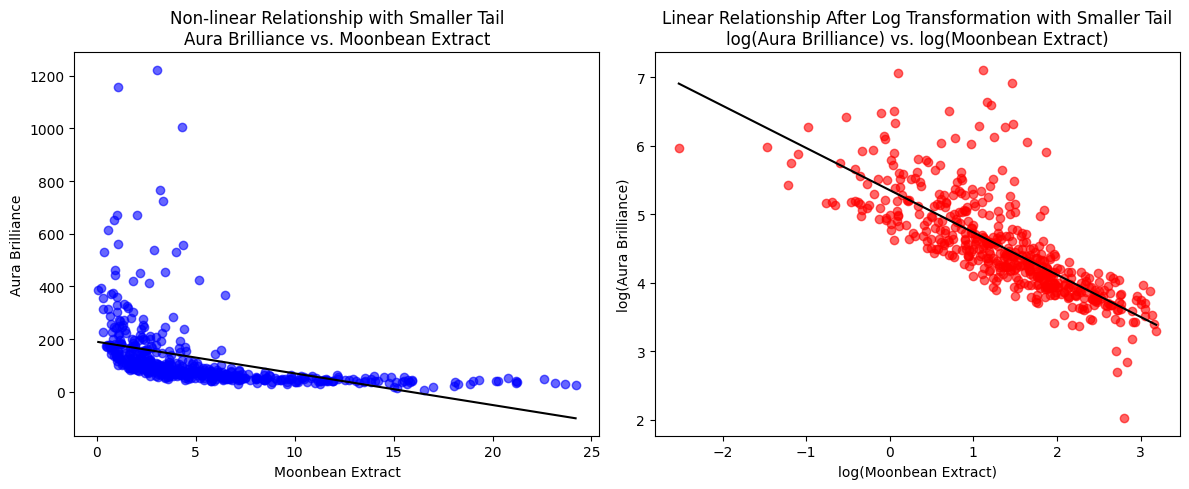
This linearity simplifies our understanding, allowing us to see how the effects of Moonbeam Extract clearly impact people's magic abilities.
A final note on log bases
Throughout this post, we've mostly used common logs, where each segment represents a tenfold increase compared to the last (log10).
Still, it's worth noting that we can also use other log bases, such as log2 or natural logarithms (logE). These alternative log bases offer different perspectives and may be better suited for specific situations or data types.
About these visualizations
We've built all these visualizations using Briefer.
If you want to build reports, presentations, or data apps with visualizations like these, you can sign up for early access to Briefer at briefer.cloud.