
In this blog post, I'll teach you how to sell books by abusing statistics. Along the way, you will learn what p-values are, what they are not, and why you should care about them.
Step 1: Understanding p-values so you can misuse them
Your first step to riches is to create a technique that you can claim to improve any aspect of your customers' lives and that you can write books about.
It doesn't matter if your technique actually works. What matters is that you can convince people that it does, and that's what I'm here to teach you.
Let's say you've created a new study technique and you believe it helps students score better on exams, for example.
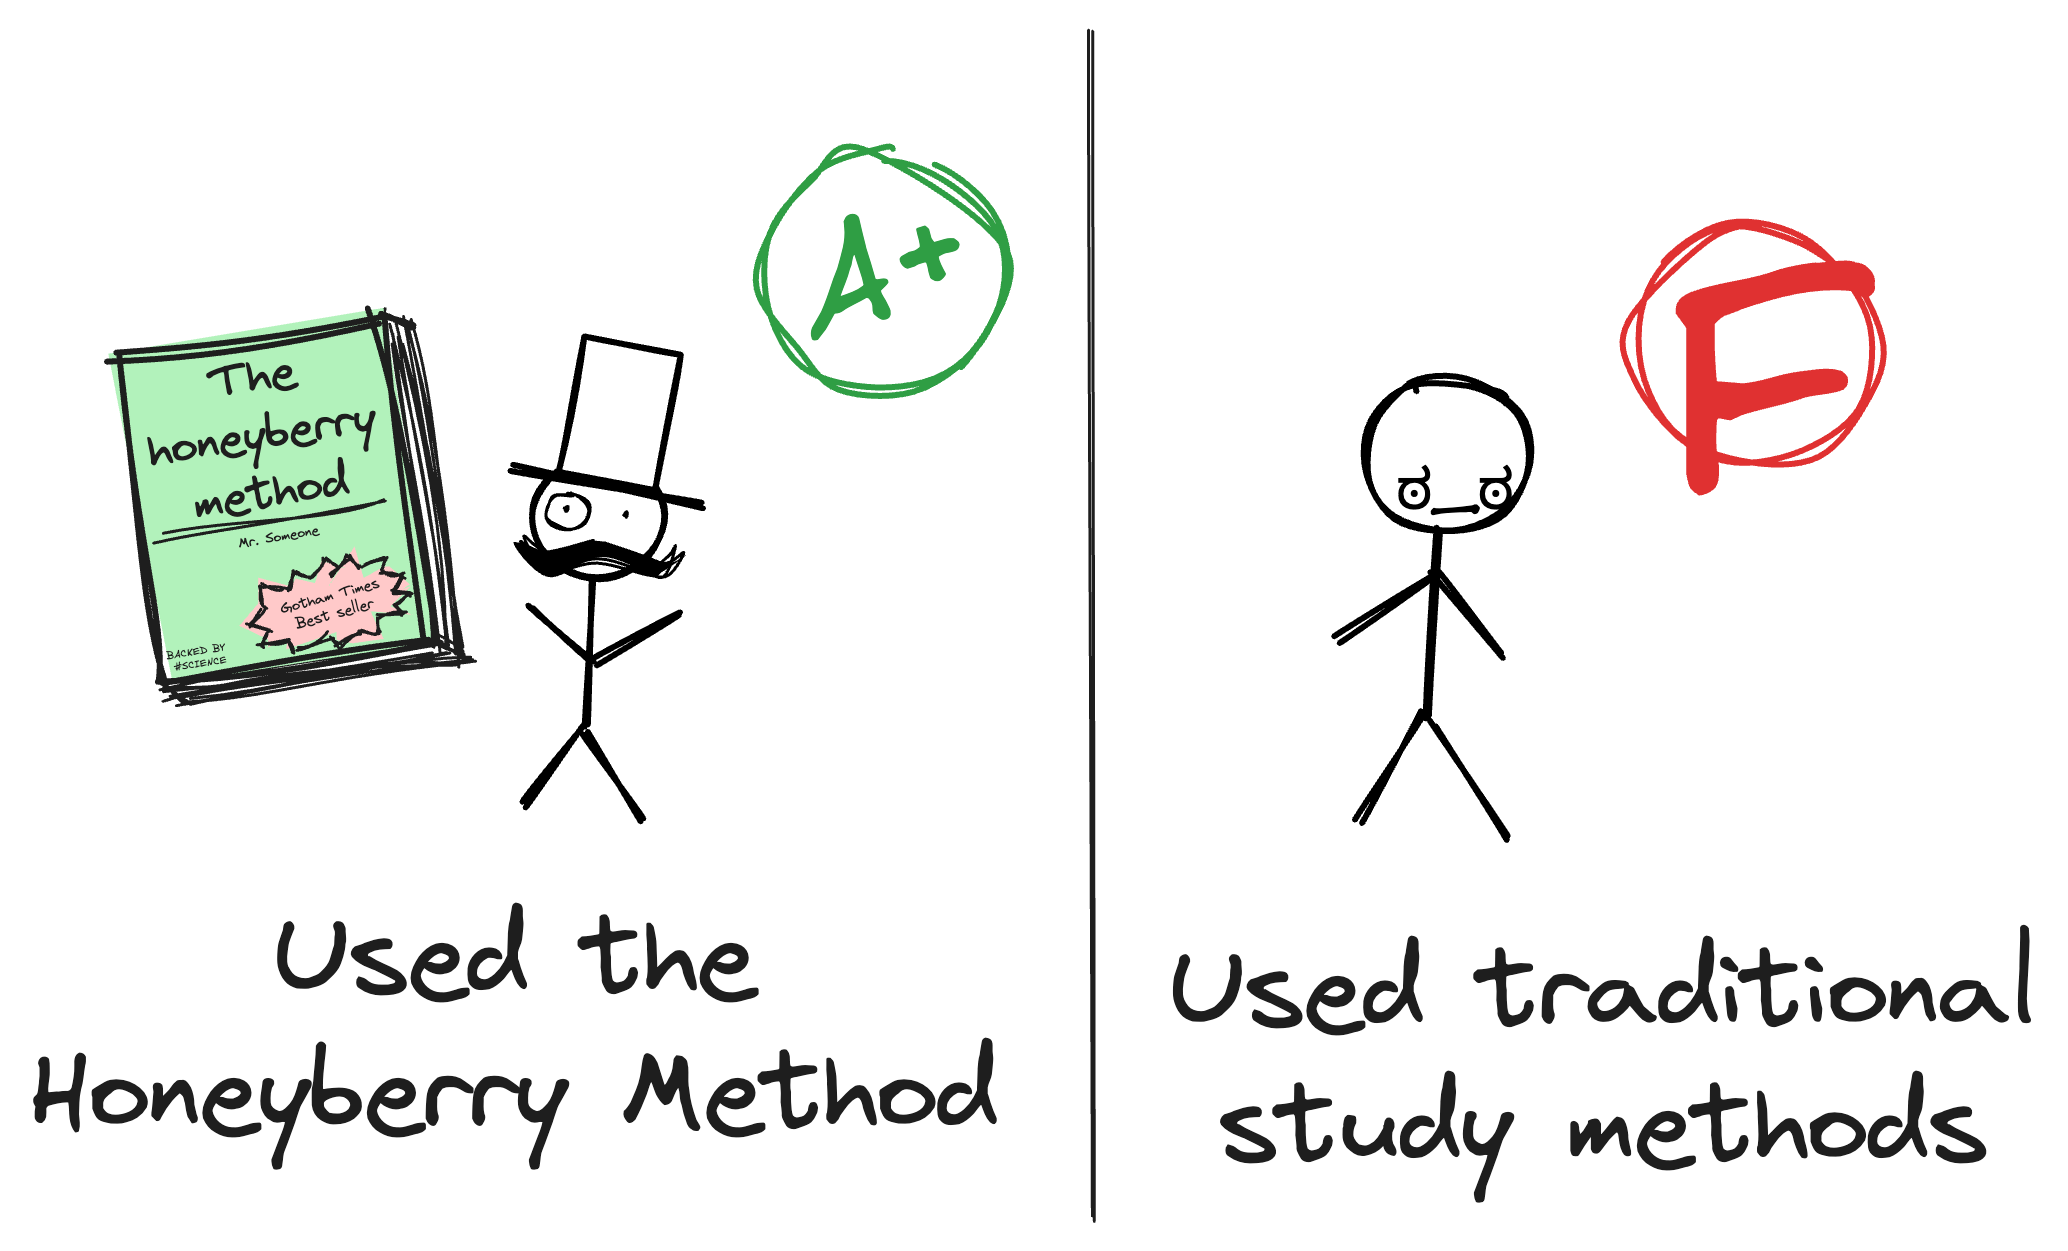
To test your hypothesis, you set up an experiment with two groups of students:
- Control Group: This group studies using traditional methods.
- Experimental Group: This group uses your revolutionary study technique.
Then, you give both groups the same exam and compare their scores. If the experimental group scores significantly higher, some people might conclude that your study technique is effective.
Now, that's where amateurs usually stop. But you're not an amateur, you're a business person. You need to convince even the nerdiest of your customers that your technique is backed by science.
These people like to think they are smart, so they'll definitely ask how do you know whether the difference in scores is real or just due to chance.
That's where p-values come in. The p-value is a statistical measure that determines how likely it is that the improvements in scores were due to random chance. In other words, p-values represent the chance of the same or more extreme scores happening even if your new study technique doesn't actually work.
A small p-value means that a difference in scores as extreme as the one you observed is unlikely to have occurred by mere luck. Thus, a small p-value suggests that your study technique might be effective.
For example, a p-value of 0.001 means there's only a 0.1% chance that the score improvement was just random. This suggests that the better scores could be due to your new study technique, not just chance.
On the other hand, a large p-value means the difference in scores could easily have happened by chance, and your study technique might not be effective.
For example, a p-value of 0.15 means there's a 15% chance that the score improvement was random. Having such extreme results 15% of times would lead nerds to say that your results are not "statistically significant", because these events are actually not that rare. In other words, they mean that the difference in scores could easily have happened by chance, and your study technique might not be effective.
The way that classical statistics works is by comparing study data to what is expected when there is nothing. If the data are not typical of what is seen when there is nothing, there must be something!
— Dallal, Gerard. The Little Handbook of Statistical Practice.
Having learned what p-values are, you probably figured that what we're after is a small p-value. So let's go ahead and make sure we get one.
Step 2: Ensuring that p is small enough
Let's be honest: the chances of your revolutionary study technique actually working are slim. Consequently, your experiment will probably fail to demonstrate that the new study technique is much different from just doing whatever everyone is already doing.
Once your study fails, you have two options. The first is to repeat the experiment until it works. The second is to analyze the data in multiple ways until you find another measure that looks significant. Then you can rebrand your technique as being effective for that measure, like "improving memory retention" or "increasing focus".
- Pro-tip 1: if none of the measures look significant, you can always try to find a subgroup of the population that benefits from your technique. For example, "our revolutionary study technique is particularly effective for left-handed students born in the summer".
- Pro-tip 2: you can also find transformations of the data that make it look significant, like the sum of outcomes squared or the log of the difference between scores.
This step is pretty easy to memorize because both alternatives rely on the fact that if you look around enough, you'll eventually find something that looks like a significant result. Another way to put it is that "the chances of winning the lottery are small, yet often there's a winner".
A crucial detail: make sure p is smaller than 0.05
There's a convention among scientists that says that a p-value below 0.05 is said to be "statistically significant". So that's what you should aim for, at least most of the time.
There are many theories about why statistical significance is set at 0.05, but, as Gerard Dallal points in his book "The Little Handbook of Statistical Practice", all of them trace back to Karl Pearson's 1914 book "Tables for Statisticians and Biometricians".
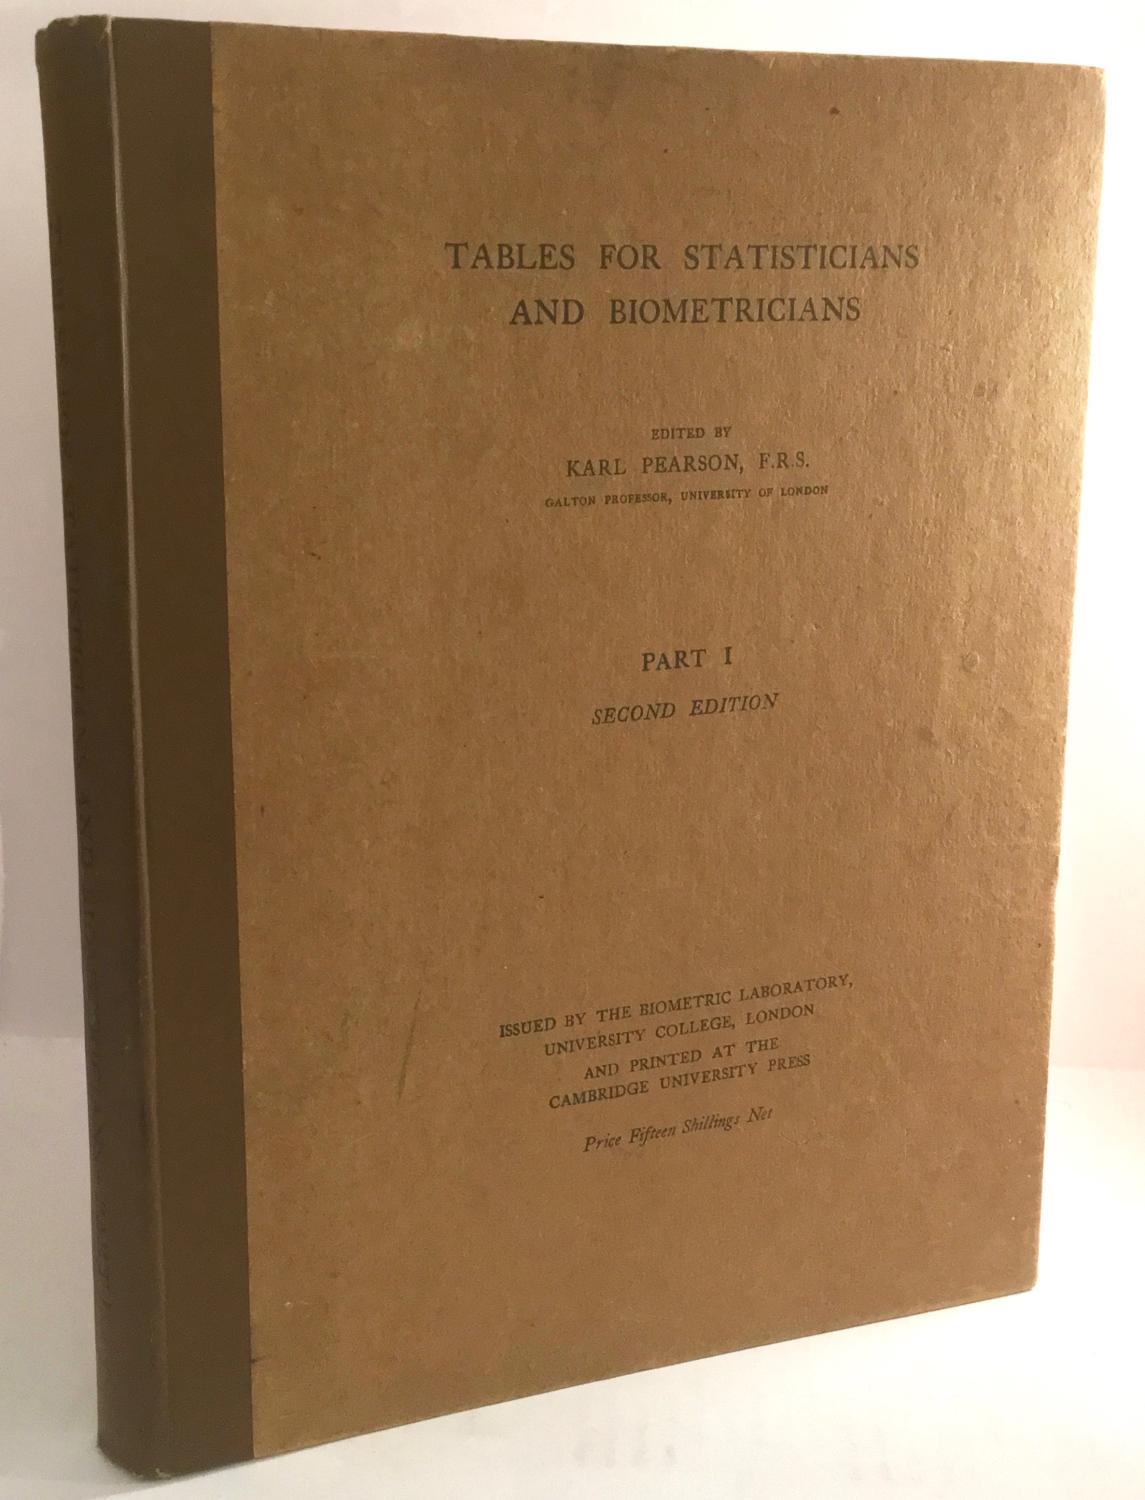
Pearson figured out how likely different outcomes were in statistics. Then Fisher made it easier by creating simple tables in his book "Statistical Methods for Research Workers" in 1925. These tables just showed basic probabilities for certain outcomes. Fisher's idea caught on, and he did the same thing with Frank Yates in 1938. People still use Fisher's tables in statistics texts today.
Fisher's tables were shorter and simpler than Pearson's. Instead of giving lots of details, they just gave rough probabilities. Fisher also came up with a neat way to show how sure we are about results—using stars. One star meant a result observed about 5% of the time, two stars meant it was observed about 1% of the time, and sometimes three stars meant it was observed about 0.1% of the time.
Fisher also said that when these extreme results would only happen 5% of the time without an intervention, we should take notice. He thought this level was good because it helped us find real results without getting too many false alarms. And this 5% rule has stuck around, shaping how we understand data and what we consider important in science.
In one sense, 5% is just a number, and it's not a magic number. But it's a good rule of thumb. Still, some people think it's too high, and that we should use lower levels like 1% or 0.1%.
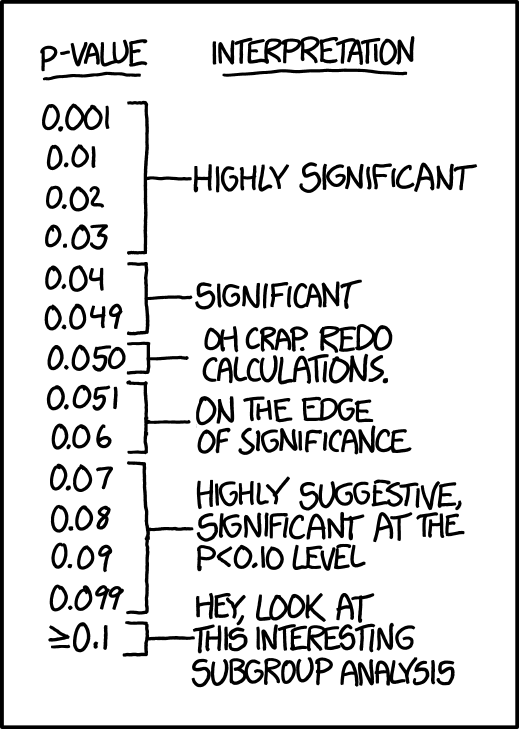
To make matters simpler, I'd also recommend that you keep this excellent table from the scientific website xkcd handy:
Step 3: Publishing your results
Now that you have a small p-value, you need to call journalists and tell them about your revolutionary study technique. They'll be thrilled to write about it, especially if you can provide them with a scientific paper that includes the words "p-value" and "statistically significant".
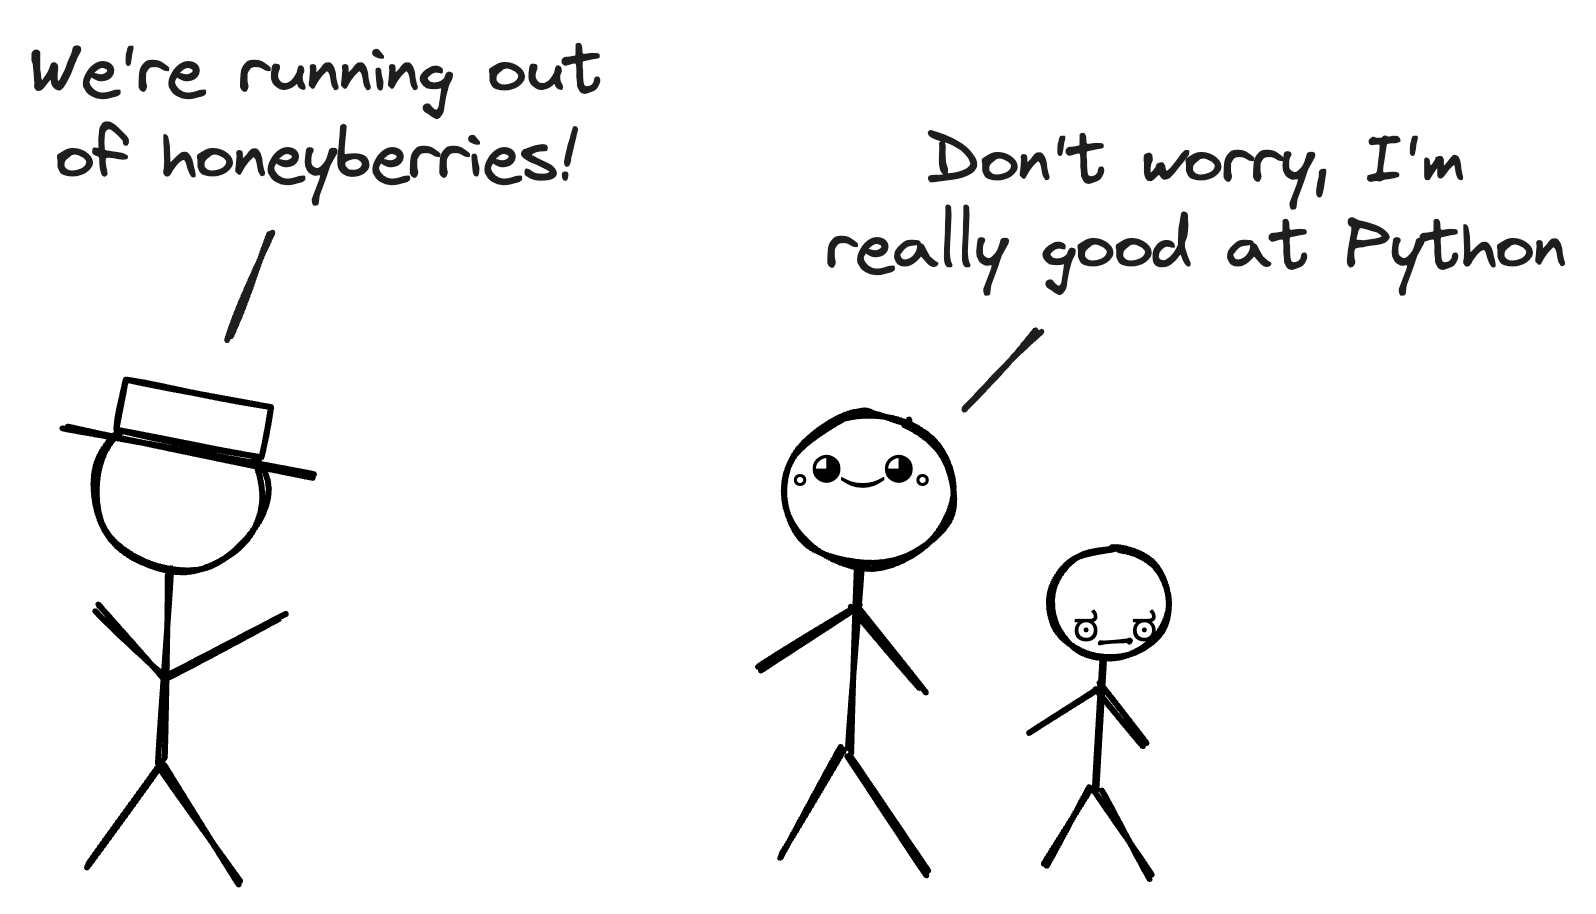
The important thing here is not to mention that you've run your experiment 100 times until you got a significant result, nor that you've written a python script to test all possible variables until you found one that looks significant.
Another important thing is to explain p-values to them in a way that doesn't sound egregious, but that is not entirely right either.
One incorrect way to explain p-values is to say that they represent the probability that the "null hypothesis" (your study technique not working) is true.
Let's say you've found a p-value of 0.001, for example. In that case, make sure to tell them that there's only a 0.1% chance that your study technique is ineffective. Although that's incorrect, it's much more convincing than saying "if the new study technique didn't work, we would still see the results we did approximately 0.1% of the time".
Another technique that you can use is to invert the logic. Instead of saying that a p-value of 0.001 means there's a 0.1% chance that the score improvement was random, they say that there's a 99.9% chance that the new study technique is effective. That's not correct either, but it's looks better in a headline.
Step 4: Rebuking the skeptics
Once your revolutionary study technique is published, you'll probably face some skepticism. That's normal, and you should be prepared to deal with it.
The scientists are the most dangerous skeptics. They'll probably try to replicate your experiment and fail to find the same results.
If it's only one or two scientists, you can always say that "failing to find an effect is different from showing that there is no effect". They won't be able to argue with that because you're technically correct.
Now, if quite a few scientists fail to replicate your results, then you're in deep trouble. That's why it's best to design experiments that are hard to replicate, like those that require a lot of data or that are too vague to be disproven.
In general, keep in mind that the best way to deal with skepticism is to prevent it from happening in the first place.
Putting it all together
- P-values are a measure of how likely it is that you'd observe the results you did if your intervention didn't actually work.
- The smaller your p-value, the less likely you are to have observed the results you did by mere luck.
- Conversely, the larger your p-value, the more likely it is that you'd observe the results you did by mere luck.
- A p-value is not the probability that the null hypothesis is true. The opposite is also true: a p-value is not the probability that your intervention is effective.
- Just because you haven't observed an effect, it doesn't mean there isn't one.
- If you run the same experiment many times, you'll eventually see a p-value below 0.05, even if the null hypothesis is true.
- Looking for an effect until you find one is an effective way to make sure you get a small p-value, but it's bad practice unless you're looking for an easy way to sell books.
- A p-value below 0.05 is usually considered "statistically significant". Although it's not a magic number, it's a rule of thumb that has been around for a while.
Before we go
In case you didn't notice, this post is a satire, and any parallels to the real world are, obviously, coincidence (no pun intended).
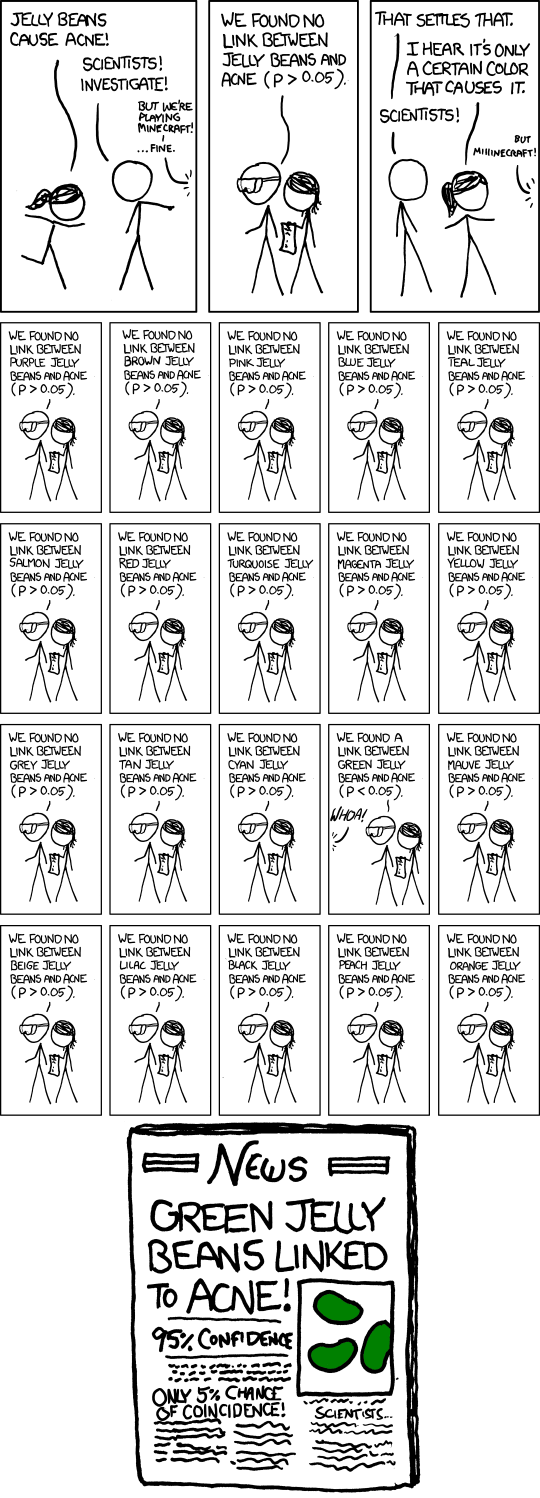
The post was inspired by the excellent work of Randall Munroe, in particular his comic xkcd 882:
Finally, if you're a data-scientist who loves jupyter notebooks or data apps, but finds them hard to share your work with others or too much hassle to deploy, you should check out Briefer.